How to Calculate True Cost per Kilometre for an Indian Fleet
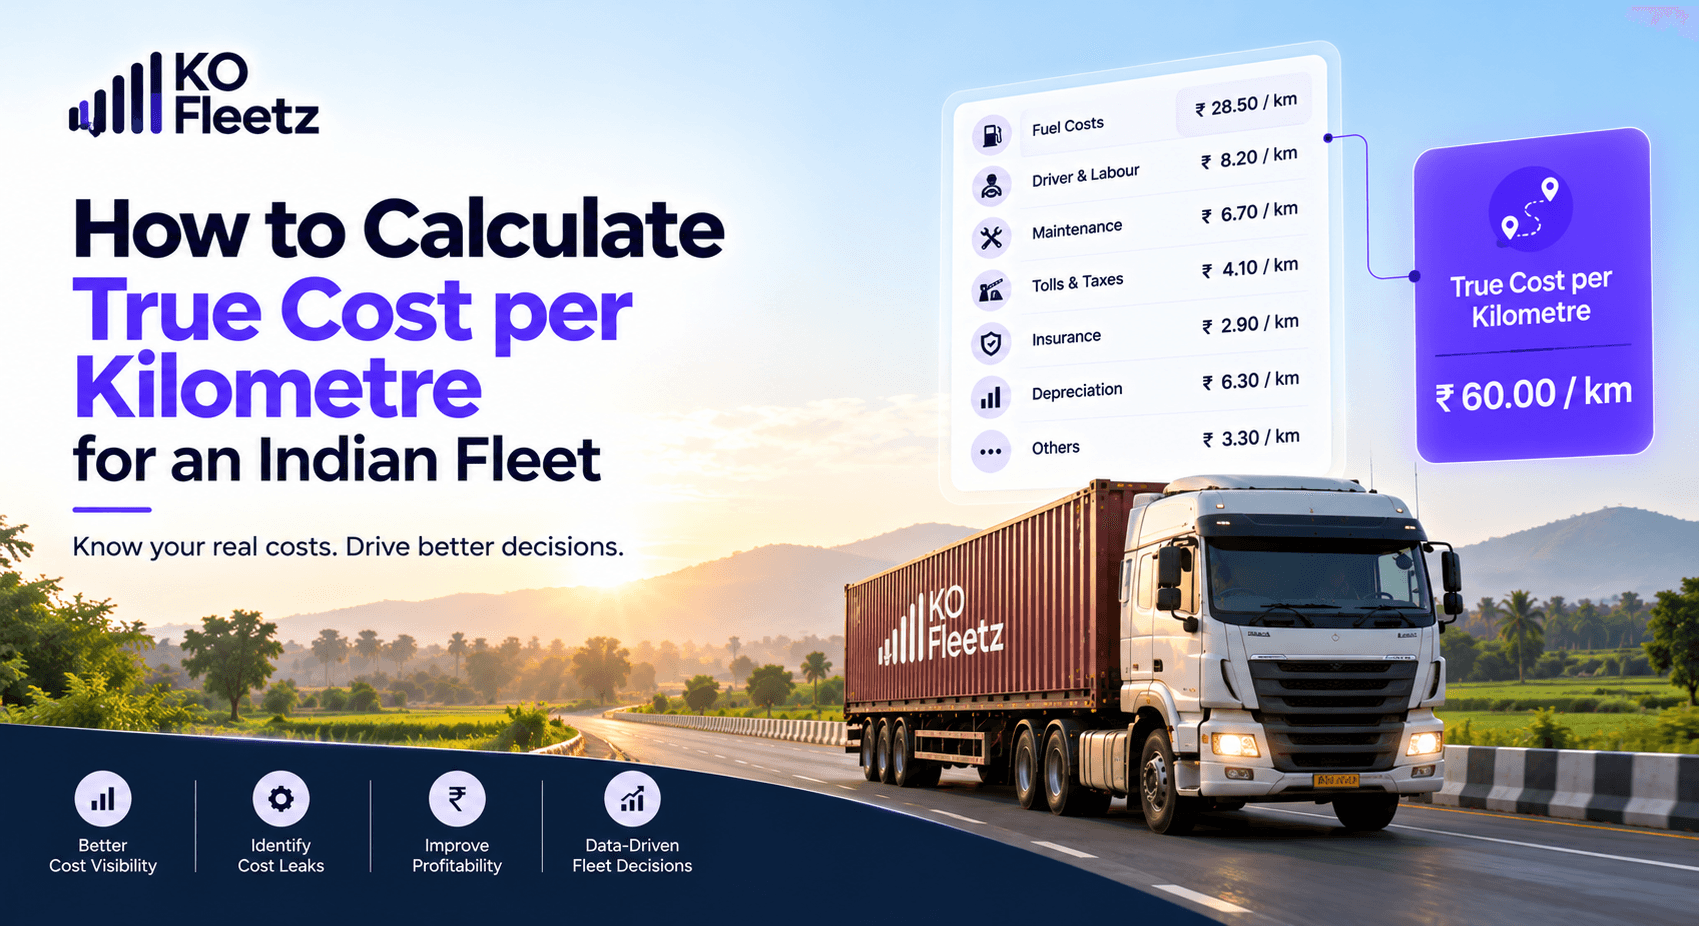
Fuel is only one part of fleet operating costs. Learn how Indian fleet owners can calculate the true cost per kilometre and identify hidden expenses affecting profitability.
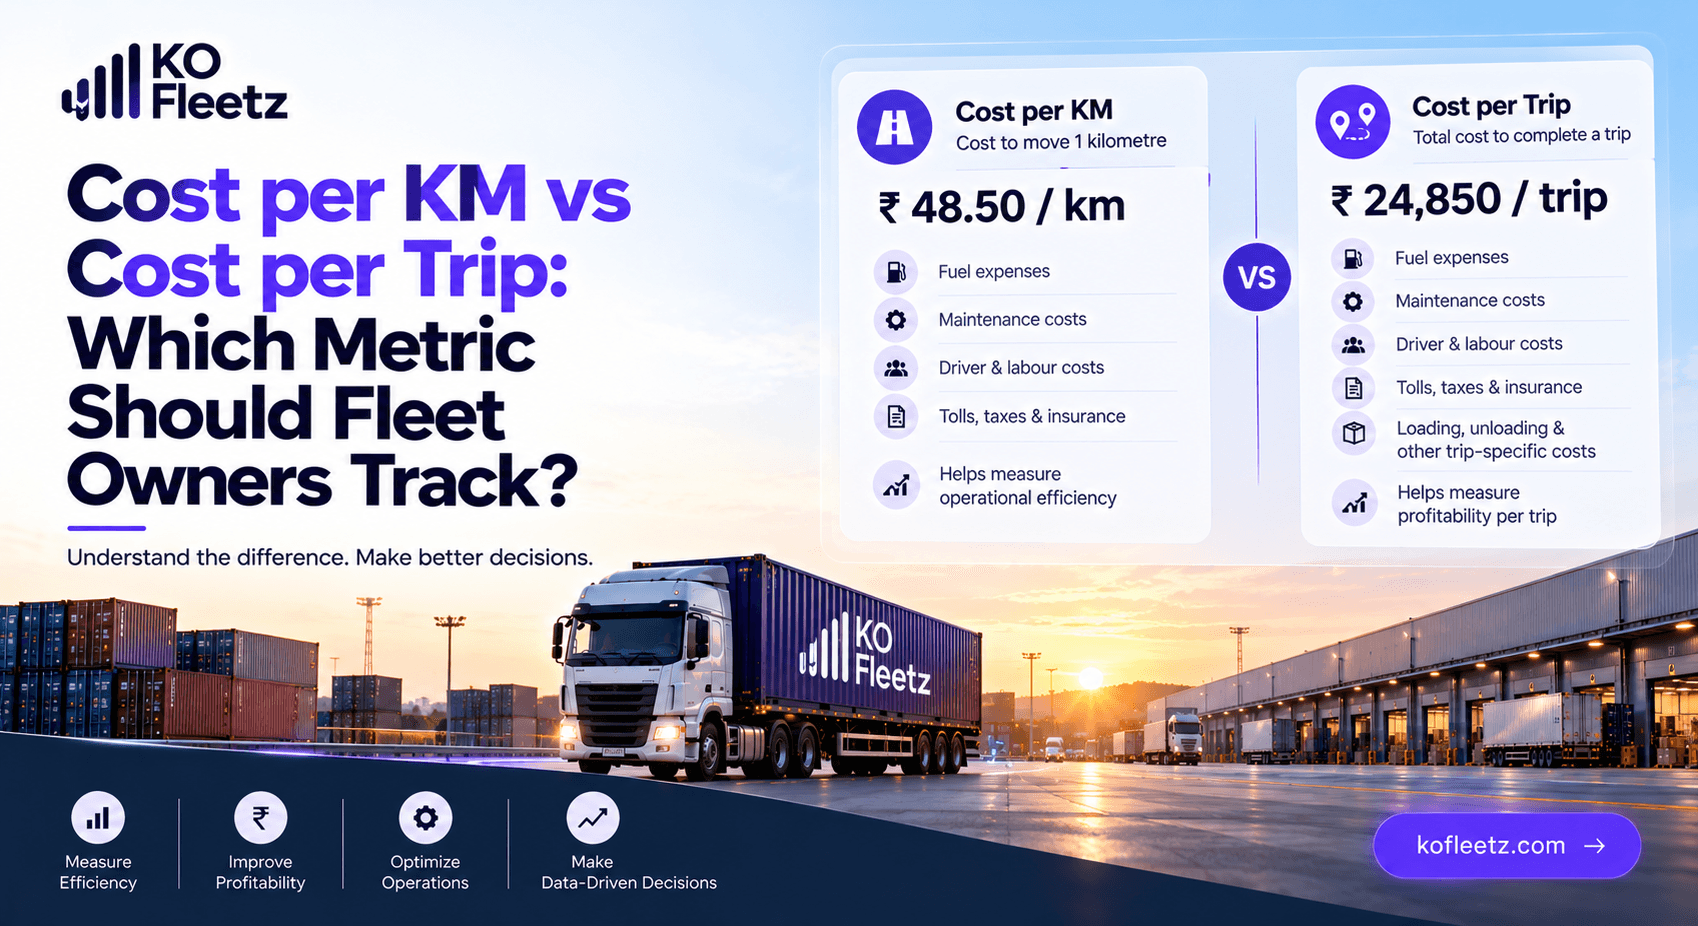
Cost per kilometre measures fleet efficiency, while cost per trip reveals the profitability of individual journeys. Learn how to use both metrics for smarter pricing and route decisions.

A truck travels 300 kilometres, completes a delivery, and returns to the depot. The journey looks successful because the vehicle reached its destination on time.
But did the trip actually make money?
Fuel, tolls, driver allowances, maintenance, vehicle depreciation, loading delays, and empty return kilometres all affect the final result.
This is why fleet owners need more than one cost metric.
Cost per kilometre helps you understand the cost of vehicle movement. Cost per trip helps you understand the cost of completing a specific journey.
For Indian transport operators, logistics companies, and fleet managers, tracking both metrics improves transportation pricing, route planning, vehicle allocation, and profitability analysis.
Cost per kilometre is the average operating cost incurred for every kilometre a vehicle travels.
It helps fleet managers compare vehicle efficiency, monitor operating expenses, and understand how distance affects fleet costs.
Formula:
Cost per KM = Total Operating Costs ÷ Total Kilometres Travelled
Suppose a truck incurs ₹90,000 in operating costs during a month and travels 4,500 kilometres.
Cost per KM = ₹90,000 ÷ 4,500
Cost per KM = ₹20
This means the truck costs an average of ₹20 for every kilometre travelled during that period.
Use this metric when you want to:
However, cost per kilometre does not automatically tell you whether an individual trip generated a profit.
A short trip with waiting time and multiple stops may cost more than expected, even when the vehicle's average cost per kilometre looks healthy.
Cost per trip is the total cost associated with completing a specific journey, from departure to delivery and any relevant return movement.
It can include fuel, tolls, driver allowances, loading and unloading expenses, trip-specific maintenance costs, and an allocated share of vehicle ownership and operating costs.
Formula:
Cost per Trip = Total Costs Attributable to the Trip
For consistent reporting, decide which costs are included and use the same rules across trips.
A commercial truck completes a delivery journey with these expenses:
| Expense | Cost |
|---|---|
| Fuel | ₹4,500 |
| Toll charges | ₹1,200 |
| Driver allowance | ₹800 |
| Loading and unloading | ₹500 |
| Maintenance allocation | ₹400 |
| Vehicle ownership allocation | ₹600 |
| Total trip cost | ₹8,000 |
The total cost of completing this journey is ₹8,000.
If the customer pays ₹10,000 for the trip, the contribution before any other excluded business expenses and applicable taxes is ₹2,000.
This gives the fleet owner a clearer picture of the economics of that particular journey.
Use this metric when you need to:
Cost per trip is particularly useful when journeys vary in distance, cargo, toll charges, delivery requirements, and waiting time.
| Comparison | Cost per KM | Cost per Trip |
|---|---|---|
| What it measures | Average cost per kilometre | Total cost of a journey |
| Main purpose | Monitor fleet efficiency | Evaluate trip economics |
| Best for | Vehicle and distance comparisons | Pricing and trip-level decisions |
| Fuel analysis | Fuel cost per kilometre | Total fuel expense per journey |
| Route decisions | Compare cost patterns across distance | Compare the total cost of alternative journeys |
| Customer pricing | Useful for per-kilometre rates | Useful for fixed-price trip quotations |
| Profitability | Requires revenue and other cost context | Can be compared directly with trip revenue |
| Main limitation | Can hide trip-specific expenses | Harder to compare trips without considering distance and workload |
The key difference: cost per kilometre tells you how much distance costs, while cost per trip tells you how much a particular journey costs.
Neither metric provides a complete picture on its own.
The answer depends on how your business charges customers.
Cost per kilometre is a useful starting point.
Suppose your calculated operating cost is ₹20 per kilometre. Quoting ₹20 per kilometre would leave no margin for any costs not already included or any desired profit.
Your rate should account for the full relevant cost base, overheads, commercial risks, and target margin.
For example, if the fully allocated cost is ₹20 per kilometre and you want a 20% margin on revenue:
Required rate = Cost per KM ÷ (1 − Target Margin)
₹20 ÷ 0.80 = ₹25 per kilometre
This produces a 20% gross margin on the assumed cost base, before any additional excluded expenses or taxes.
Cost per trip is usually more directly relevant.
If a journey costs ₹8,000 and the agreed customer price is ₹10,000, the difference is ₹2,000 before excluded costs and applicable taxes.
But if toll charges increase, waiting time expands, or the vehicle returns empty, the trip economics can change.
Calculate the expected cost of the entire journey before finalising a fixed quotation.
Some contracts combine a base trip rate with additional charges for extra kilometres, waiting time, tolls, or special handling.
In these cases, use both metrics to establish the base price and understand how additional operating conditions affect the final cost.
Imagine your fleet has two possible routes for the same delivery.
<text color="secondary" size="sm">250 km · Higher toll charges · Faster transit</text>
- Lower distance travelled
- Potentially higher toll expense
- May reduce driver time and delivery delays
</box>
<text color="secondary" size="sm">290 km · Lower toll charges · Longer transit</text>
- More kilometres travelled
- Potentially lower toll expense
- May increase fuel consumption and vehicle time
</box>
The shortest route is not always the cheapest, and the route with lower tolls is not always the most profitable.
To make the right decision:
Use actual trip data to validate estimates and improve future route decisions.
You may miss:
A vehicle can have an acceptable average cost per kilometre while completing certain trips at a loss.
You may miss:
A trip might appear profitable while the vehicle assigned to it remains expensive to operate overall.
Track both metrics to connect fleet efficiency with commercial performance.
For more complete fleet cost management, monitor these additional indicators:
These indicators help fleet managers move from simply tracking expenses to understanding why costs change.
Calculating fleet costs manually across multiple vehicles and routes can be time-consuming. Disconnected spreadsheets also make it difficult to compare trip expenses with actual vehicle movement.
Fleet management software can help centralise the information required for cost analysis, including:
With KO Fleetz, fleet operators can bring fleet tracking, trip management, fuel management, maintenance information, and analytics into a connected operational platform.
This helps managers investigate cost variations, compare vehicle performance, and make more informed decisions about routes and customer pricing.
Accurate results still depend on complete expense records, appropriate cost allocation, and reliable data.
No. Cost per kilometre measures average cost for each kilometre travelled, while cost per trip measures the total cost of completing a specific journey.
Both are important. Cost per kilometre helps monitor vehicle efficiency and distance-based costs. Cost per trip helps evaluate individual journeys, set quotations, and understand trip profitability.
Add the relevant fuel, toll, driver, loading, maintenance, and allocated vehicle ownership costs associated with the journey. Use consistent cost allocation rules to compare trips accurately.
Compare total trip costs across alternative routes, including fuel, tolls, distance, travel time, driver costs, and expected delays. Use actual operational data to validate route estimates.
Fleet management software can help calculate or analyse cost per kilometre when it has reliable distance data and complete operating expense information. Check that the platform supports the required reports and cost allocation methods.
Cost per kilometre and cost per trip answer different questions, but together they provide a stronger foundation for fleet cost management.
Use cost per kilometre to understand operating efficiency. Use cost per trip to evaluate journey costs, price contracts, and compare route economics.
Then connect both metrics with fuel, tolls, maintenance, utilisation, and revenue to understand which vehicles and journeys contribute to your business goals.
Stop relying on distance alone to judge fleet performance.
With KO Fleetz, bring fleet operations and analytics together to improve cost visibility, investigate inefficiencies, and make smarter transportation decisions.
Explore KO Fleetz and book a demo to see how connected fleet intelligence can support better fleet cost management.

Fuel is only one part of fleet operating costs. Learn how Indian fleet owners can calculate the true cost per kilometre and identify hidden expenses affecting profitability.

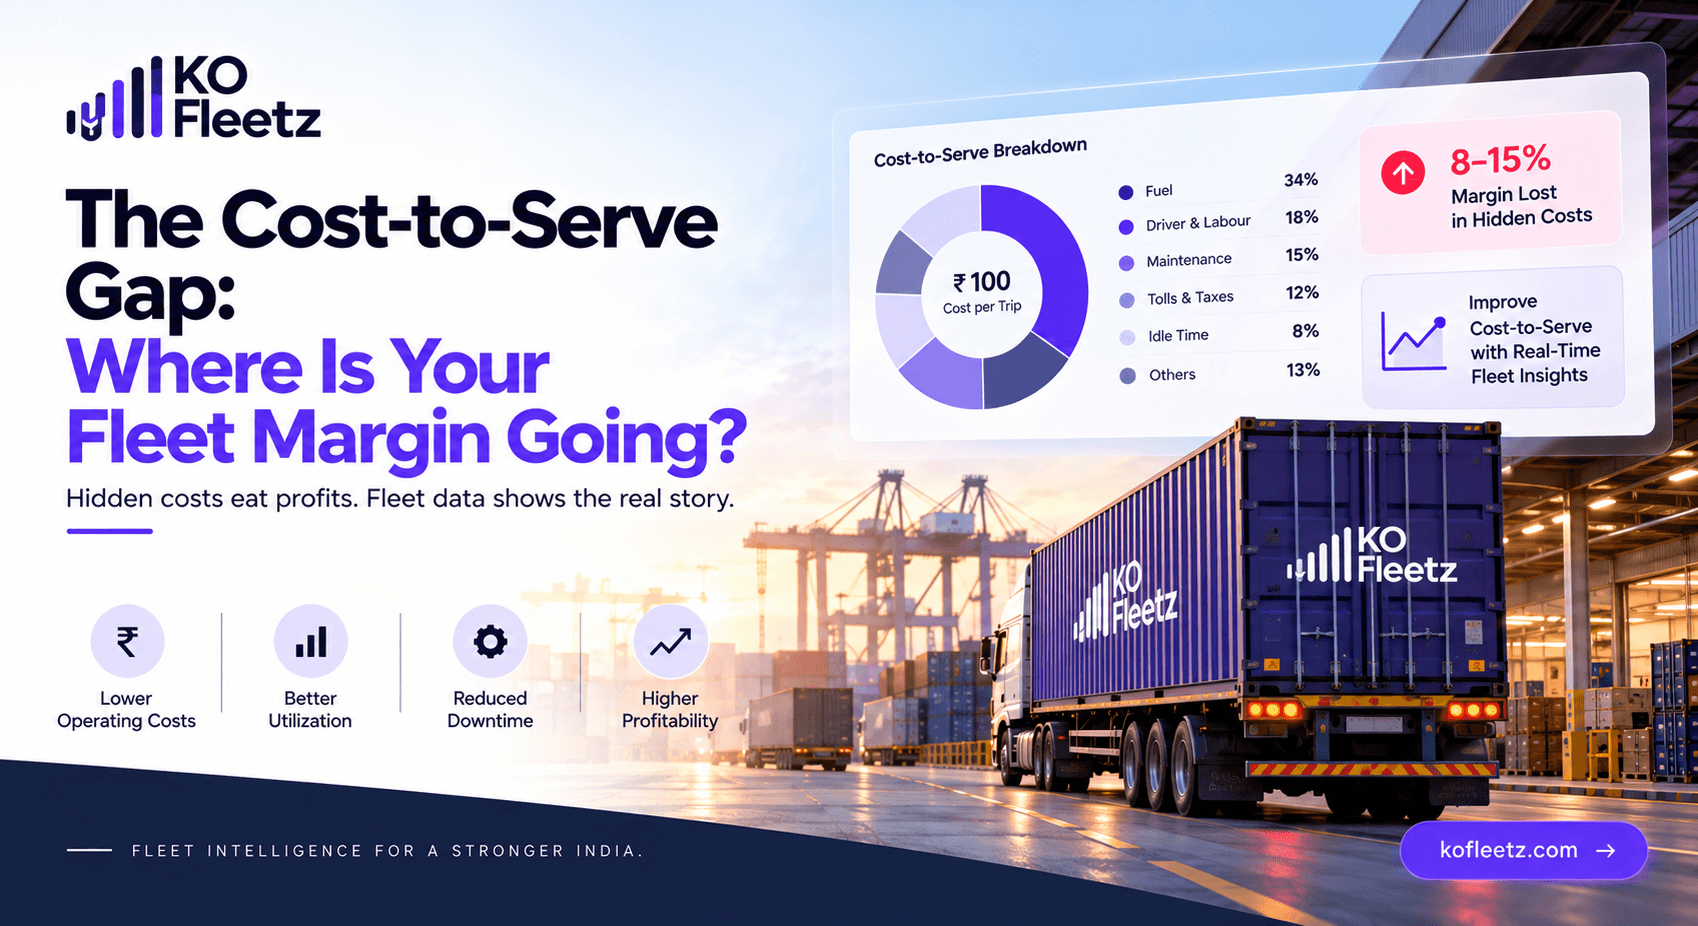
Fleet margins can disappear through small, hidden costs across fuel, maintenance, idle time, routes, and trips. Learn how to identify the cost-to-serve gap and protect profitability.

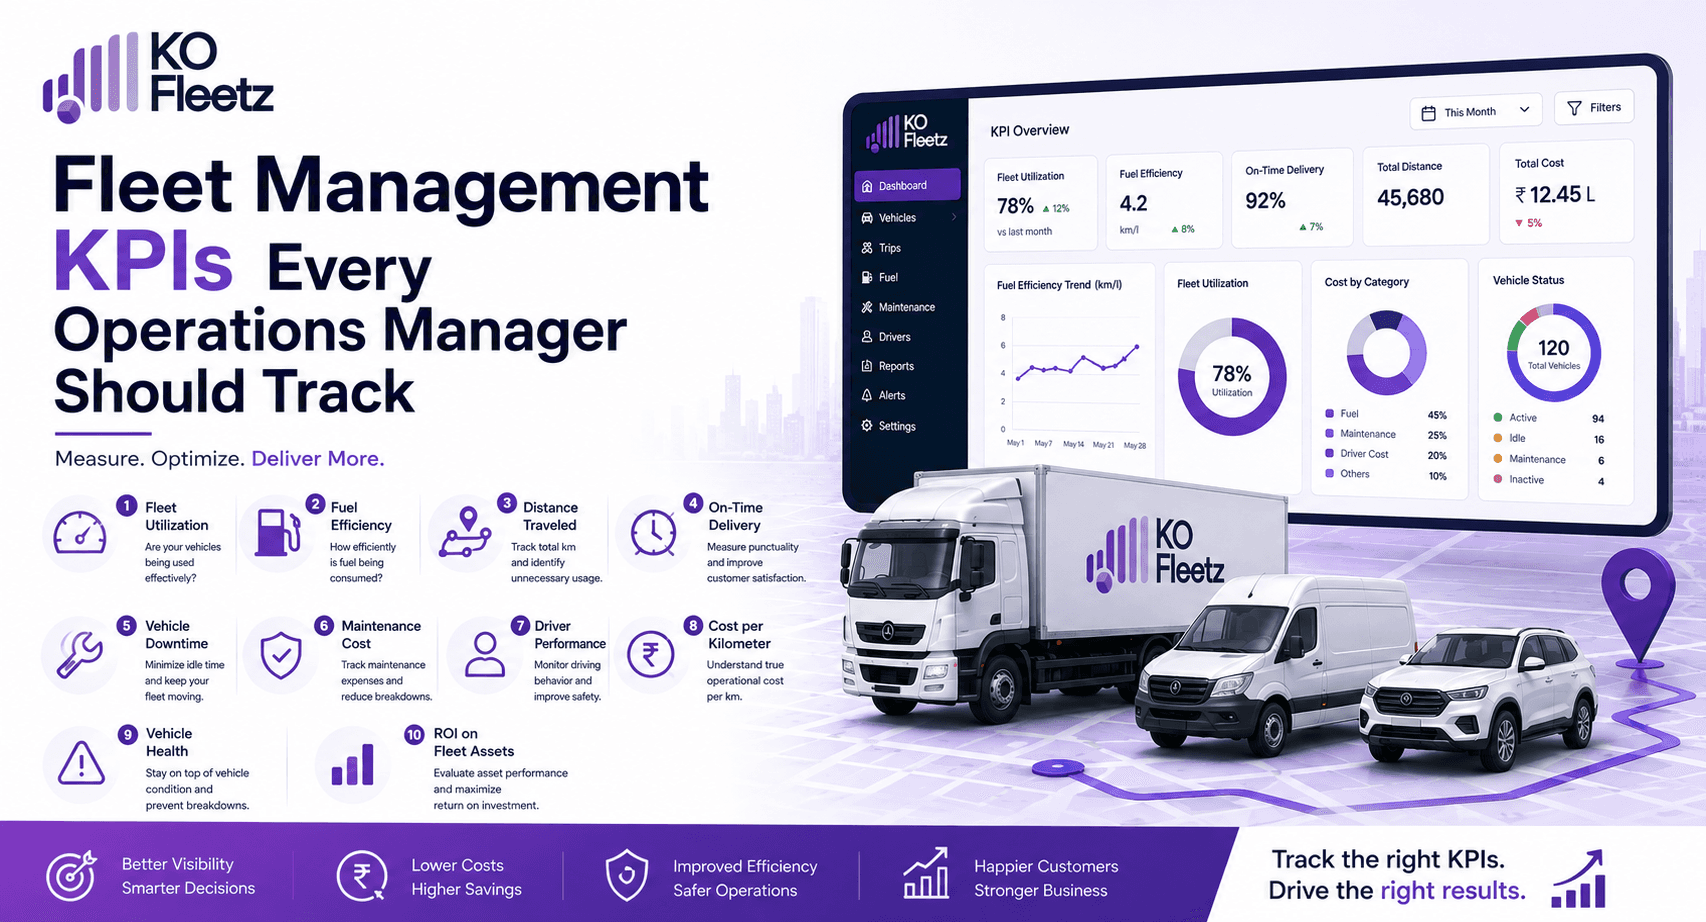
Fleet management KPIs help operations managers measure utilization, fuel use, maintenance, safety, and delivery performance. Track these 15 key metrics to improve efficiency, control costs, and make better decisions with data.
A 30-minute walkthrough using your vehicles, your routes and the problems you are actually trying to solve.