Skip to content
Fleet Analytics

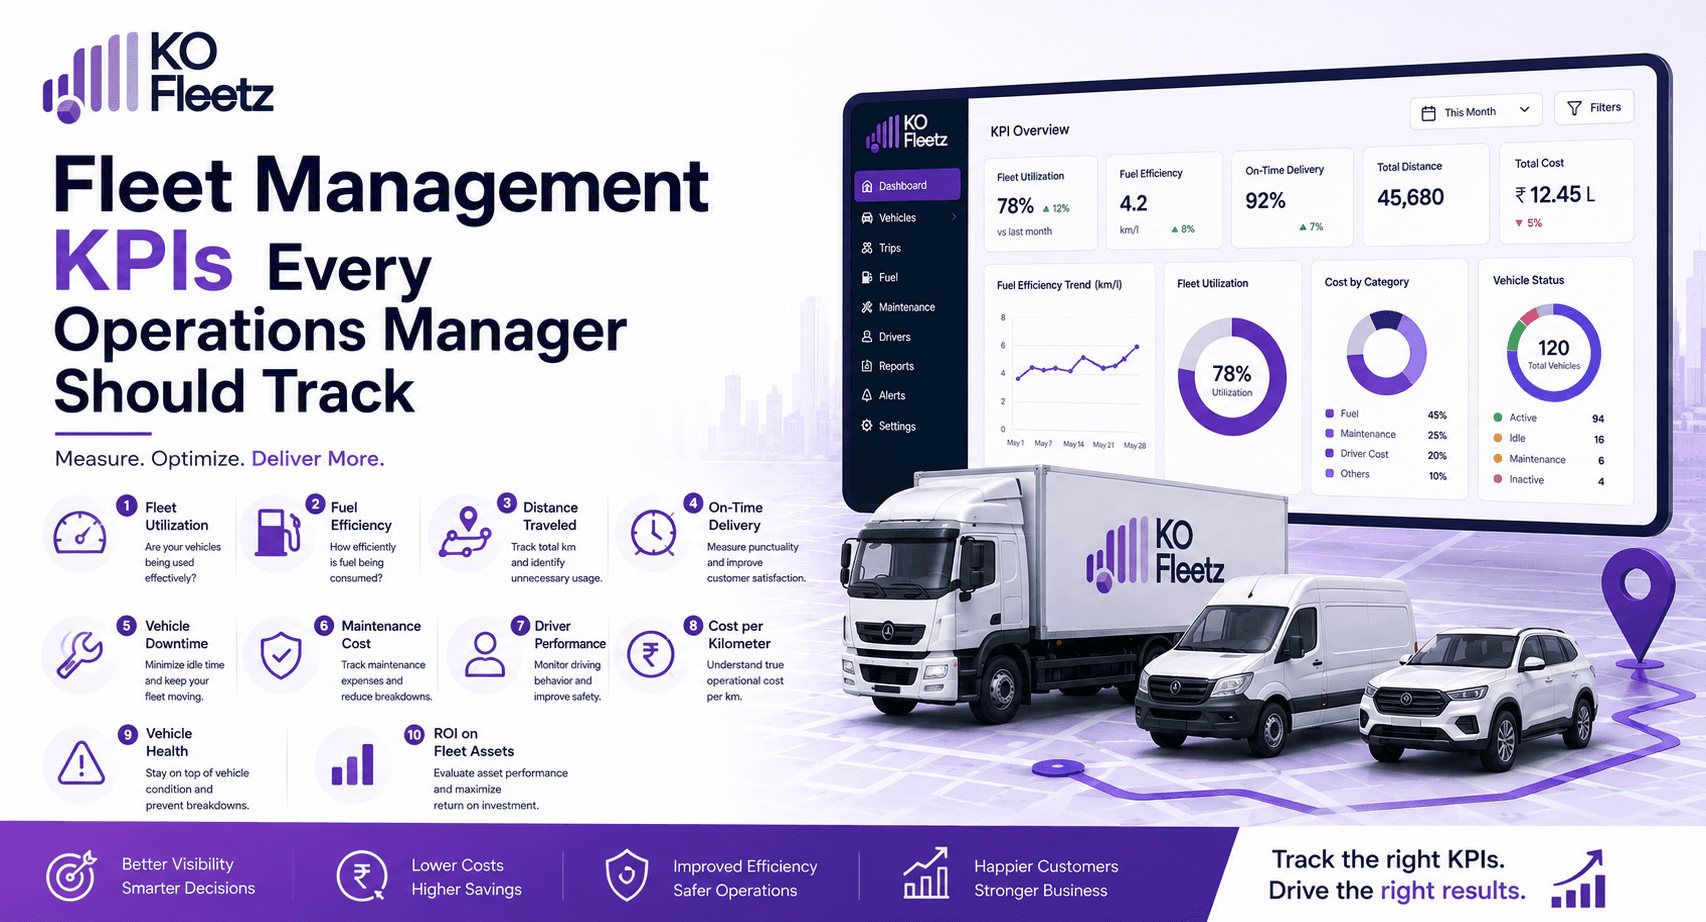
Fleet Management KPIs Every Operations Manager Should Track

Fleet management KPIs help operations managers measure utilization, fuel use, maintenance, safety, and delivery performance. Track these 15 key metrics to improve efficiency, control costs, and make better decisions with data.

KO Fleetz Admin17 August 202618 min read
Fleet Management KPIs Every Operations Manager Should Track
On this page

Introduction

Managing a fleet is no longer simply about knowing where vehicles are.

Modern fleet operations involve fuel costs, maintenance, driver productivity, vehicle utilization, delivery performance, safety, route efficiency, and customer expectations. When these areas are managed independently, operations managers can struggle to understand what is actually driving fleet costs and performance.

This is where fleet management KPIs become essential.

Key performance indicators give operations managers measurable information about how efficiently their fleet is operating. Instead of relying on assumptions such as "fuel costs seem high" or "some vehicles don't appear to be productive," managers can use data to identify exactly where performance is improving or declining.

For logistics and transportation businesses, the right combination of fleet metrics, fleet tracking, and fleet analytics can provide a clearer picture of day-to-day operations.

A modern fleet management platform can bring together vehicle location, mileage, fuel consumption, maintenance information, route performance, driver activity, and delivery data in one place.

In this article, we'll explore 15 fleet management KPIs every operations manager should track, why each metric matters, and how technology can help turn fleet data into better operational decisions.


What Are Fleet Management KPIs?

Fleet management KPIs are measurable indicators used to evaluate the efficiency, productivity, cost, safety, and overall performance of a vehicle fleet.

They help answer questions such as:

  • Are vehicles being utilized effectively?
  • How much fuel is the fleet consuming?
  • Are vehicles being maintained properly?
  • Are deliveries completed on time?
  • Which vehicles are costing the most to operate?
  • Are drivers following planned routes?
  • How much downtime is affecting operations?
  • Is fleet productivity improving?
  • Are operational costs increasing or decreasing?

The right KPIs depend on the fleet's business model.

For example, a last-mile delivery company may prioritize:

On-time delivery + cost per delivery + route efficiency

A trucking company may focus more heavily on:

Fuel efficiency + vehicle utilization + empty kilometres + maintenance

A field-service fleet may prioritize:

Jobs completed + technician travel time + vehicle availability

Therefore, fleet KPIs should always be connected to business objectives.


Why Fleet Management KPIs Matter

Without measurable KPIs, fleet management can become reactive.

A problem is discovered only after costs increase or customer complaints appear.

With consistent KPI tracking, operations managers can identify trends earlier.

For example:

Fuel consumption increases

Fleet analytics identifies high fuel usage in specific vehicles

Fleet manager investigates routes, idling, and driving patterns

Operational issue is identified

Corrective action is implemented

Fuel KPI is monitored again

This creates a continuous improvement cycle.

The goal of KPI tracking isn't simply to create dashboards.

It is to use data to make better decisions.


15 Fleet Management KPIs Every Operations Manager Should Track

1. Fleet Utilization Rate

Fleet utilization measures how effectively available vehicles are being used.

A vehicle can be technically available but still spend much of its day parked or waiting.

A basic calculation is:

Fleet Utilization % = Productive Operating Hours ÷ Available Operating Hours × 100

For example:

If a vehicle is available for 10 hours and performs productive work for 8 hours:

8 ÷ 10 × 100 = 80%

Why it matters

Low utilization may indicate:

  • Excess fleet capacity
  • Poor scheduling
  • Low demand
  • Uneven vehicle allocation
  • Excessive downtime
  • Inefficient route planning

Operations managers should examine both overall fleet utilization and individual vehicle utilization.


2. Vehicle Availability

Vehicle availability measures how many vehicles are ready for operational use.

A simple formula is:

Vehicle Availability % = Available Vehicles ÷ Total Fleet × 100

For example:

A fleet has 100 vehicles.

If 92 are available:

92% availability

The remaining vehicles may be unavailable because of:

  • Maintenance
  • Repairs
  • Accidents
  • Inspections
  • Administrative restrictions

High availability is particularly important for businesses operating under tight delivery schedules.

A fleet can have excellent vehicles on paper but still struggle operationally if too many assets are unavailable.


3. Fuel Consumption

Fuel is often one of the largest variable costs in fleet operations.

Common fuel metrics include:

  • Litres per 100 km
  • Kilometres per litre
  • Total litres consumed
  • Fuel cost per kilometre
  • Fuel cost per trip
  • Fuel cost per delivery

Tracking fuel consumption by vehicle can help identify unusual patterns.

For example:

Vehicle A: 4.5 km/L

Vehicle B: 3.1 km/L

If both vehicles operate under similar conditions, Vehicle B deserves investigation.

Potential causes may include:

  • Excessive idling
  • Poor driving behaviour
  • Heavy loads
  • Inefficient routes
  • Mechanical issues
  • Traffic exposure

This is where fleet tracking and fleet analytics can work together.


4. Fuel Cost Per Kilometre

Total fuel spending alone does not provide enough context.

Fuel cost per kilometre provides a more useful operational comparison.

Fuel Cost per KM = Total Fuel Cost ÷ Total Distance Travelled

This KPI helps managers understand how efficiently vehicles are converting fuel expenditure into vehicle movement.

It can also be compared across:

  • Vehicles
  • Routes
  • Drivers
  • Regions
  • Vehicle types
  • Time periods

If fuel cost per kilometre rises significantly, operations managers can investigate the underlying cause before the increase becomes a major cost problem.


5. Average Cost Per Vehicle

Fleet managers should understand how much each vehicle costs to operate.

Fleet operating costs may include:

  • Fuel
  • Maintenance
  • Repairs
  • Insurance
  • Tolls
  • Driver costs
  • Depreciation
  • Leasing or financing
  • Registration
  • Other operating expenses

Tracking average cost per vehicle allows managers to compare assets and identify expensive outliers.

For example, if one vehicle consistently costs significantly more to operate than similar vehicles, management may need to evaluate:

  • Maintenance history
  • Age
  • Fuel efficiency
  • Utilization
  • Repair frequency
  • Replacement economics

6. Maintenance Cost Per Vehicle

Maintenance costs should be monitored at the individual vehicle level.

Track:

Total maintenance cost ÷ vehicle

and compare it over time.

Useful maintenance metrics include:

  • Preventive maintenance cost
  • Corrective maintenance cost
  • Repair cost
  • Parts cost
  • Labour cost
  • Maintenance cost per kilometre

A sudden increase can indicate an aging vehicle or recurring mechanical problem.

This helps fleet managers move from reactive maintenance toward proactive asset management.


7. Vehicle Downtime

Downtime measures how long vehicles remain unavailable for productive operations.

Downtime can result from:

  • Mechanical failures
  • Preventive maintenance
  • Accidents
  • Parts shortages
  • Inspections
  • Unexpected repairs

A vehicle generating zero productive output while unavailable can affect the entire operation.

Track:

Total downtime per vehicle

and

Downtime percentage

Comparing downtime across vehicles can identify assets that require closer attention.


8. Preventive Maintenance Compliance

Preventive maintenance is one of the most important operational KPIs for fleet managers.

Track the percentage of scheduled maintenance tasks completed on time.

Preventive Maintenance Compliance % = On-Time Maintenance Tasks ÷ Scheduled Maintenance Tasks × 100

A low compliance rate can increase the risk of:

  • Unexpected breakdowns
  • Higher repair costs
  • Vehicle downtime
  • Safety issues
  • Shorter vehicle lifespan

For large fleets, fleet management software can help automate maintenance reminders and service schedules.


9. On-Time Delivery Rate

For logistics and transportation businesses, delivery performance is a critical KPI.

On-Time Delivery % = On-Time Deliveries ÷ Total Deliveries × 100

For example:

If 950 of 1,000 deliveries arrive within the promised time window:

95% on-time delivery

This metric provides insight into:

  • Route performance
  • Driver productivity
  • Scheduling accuracy
  • Traffic impact
  • Dispatch efficiency
  • Customer service

A decline in on-time performance may indicate that routes, delivery schedules, or resource allocation need adjustment.


10. Route Adherence

Route adherence measures how closely vehicles follow their planned routes.

This is particularly valuable when using fleet management software with route optimization.

Managers can compare:

Planned route vs actual route

Significant deviations may occur because of:

  • Traffic
  • Road closures
  • Customer requests
  • Driver decisions
  • Incorrect route planning
  • Unplanned stops

Not every deviation is a problem.

The goal is to identify repeated or unexplained deviations that affect cost and productivity.


11. Idle Time

Idle time measures how long vehicles remain running without productive movement.

Excessive idling can increase:

  • Fuel consumption
  • Engine wear
  • Operating costs
  • Emissions

Track idle time by:

  • Vehicle
  • Driver
  • Location
  • Time period

For example, if a vehicle spends 90 minutes idling every day, the cumulative impact across a large fleet can become substantial.

Reducing unnecessary idling can therefore support both fuel efficiency and fleet productivity.


12. Driver Productivity

Vehicles do not operate independently of drivers.

Driver productivity can be measured using operational metrics such as:

  • Deliveries completed
  • Jobs completed
  • Driving hours
  • Productive hours
  • Stops completed
  • Route adherence
  • Idle time
  • On-time performance

For example:

Deliveries per driver per day

can provide a useful productivity benchmark for delivery fleets.

Driver performance should always be evaluated in context.

A driver handling difficult routes, heavy traffic, or high service-time requirements should not be compared directly with someone operating in a completely different environment.


13. Accident and Safety Rate

Safety KPIs should be an important part of fleet performance management.

Useful safety metrics include:

  • Accidents per 100,000 km
  • Accidents per vehicle
  • Harsh braking events
  • Harsh acceleration events
  • Speeding incidents
  • Seat-belt violations
  • Driver safety alerts

Fleet tracking systems can help provide visibility into driving behaviour and vehicle activity.

The objective should not simply be to collect violations.

The objective is to identify patterns and create safer operating practices.


14. Empty Kilometres

Empty kilometres represent distance travelled without a productive load, passenger, pickup, or delivery activity.

This can be a major issue for logistics and transportation businesses.

For example:

Loaded trip: 200 km

Empty return: 180 km

A significant portion of the vehicle's total travel generated limited productive value.

Reducing empty kilometres can improve:

  • Fleet productivity
  • Fuel efficiency
  • Vehicle utilization
  • Cost per trip
  • Revenue per kilometre

Route optimization, better load planning, and improved pickup scheduling can help address this issue.


15. Cost Per Delivery or Job

One of the most valuable fleet management KPIs is the cost associated with completing each productive activity.

For delivery businesses:

Cost Per Delivery = Total Fleet Operating Cost ÷ Number of Deliveries

For field-service businesses:

Cost Per Job = Fleet Operating Cost ÷ Completed Jobs

This KPI brings multiple operational factors together.

If cost per delivery increases, managers can investigate:

  • Fuel consumption
  • Driver costs
  • Route efficiency
  • Vehicle utilization
  • Maintenance costs
  • Empty kilometres
  • Delivery density

It helps connect fleet performance directly to business economics.


Fleet Management KPI Dashboard

A well-designed KPI dashboard should make important information easy to understand.

An operations manager might monitor:

KPICurrentTargetStatus
Fleet Utilization78%85%Needs attention
Vehicle Availability94%95%Near target
On-Time Delivery96%95%On target
Fuel Efficiency4.2 km/L4.5 km/LNeeds attention
Idle Time7%<5%Needs attention
Maintenance Compliance93%95%Near target
Empty KM12%<10%Needs attention
Accident Rate1.4/100k km<1.5On target

The exact benchmarks should be customized to the company's fleet, industry, geography, and operating model.


Which Fleet Management KPIs Should Logistics Companies Prioritize?

For logistics companies, some metrics are particularly important.

A strong starting KPI set includes:

Operational KPIs

  • Fleet utilization
  • Vehicle availability
  • Deliveries per vehicle
  • On-time delivery
  • Route adherence

Cost KPIs

  • Fuel cost per kilometre
  • Cost per delivery
  • Maintenance cost
  • Cost per vehicle

Productivity KPIs

  • Deliveries per driver
  • Empty kilometres
  • Capacity utilization
  • Productive operating hours

Safety KPIs

  • Accident rate
  • Speeding events
  • Harsh braking
  • Driver safety incidents

This creates a balanced view of fleet performance.


Fleet Management Software for Logistics Companies

Managing all these KPIs manually can become difficult as fleet size increases.

This is where fleet management software for logistics companies can provide significant value.

Instead of maintaining separate spreadsheets for fuel, vehicle locations, maintenance, deliveries, and driver performance, a centralized platform can connect operational data.

A modern fleet management system can provide visibility into:

  • Vehicle location
  • GPS tracking
  • Route performance
  • Fuel consumption
  • Vehicle utilization
  • Maintenance
  • Driver activity
  • Delivery performance
  • Fleet analytics

This helps operations managers move from manual reporting toward data-driven fleet management.


Fleet Management Software With GPS Tracking

Fleet management software with GPS tracking provides real-time visibility into vehicle locations and movement.

GPS data can support KPI tracking for:

  • Distance travelled
  • Route adherence
  • Vehicle activity
  • Idle time
  • Trip duration
  • Unauthorized movement
  • Vehicle utilization

Instead of asking where a vehicle was at the end of the day, managers can access a continuous view of fleet activity.

For businesses with distributed vehicles, this visibility can significantly improve operational control.


Fleet Tracking Software for Logistics Companies

For logistics businesses, fleet tracking software for logistics companies can connect vehicle location with delivery operations.

Operations managers can monitor:

  • Vehicle movement
  • Delivery progress
  • Route deviations
  • Estimated arrival
  • Driver activity
  • Vehicle status

This helps bridge the gap between traditional GPS tracking and broader fleet performance management.

Tracking location is useful.

But tracking location alongside operational KPIs is even more valuable.


GPS Fleet Tracking Software for Businesses

GPS fleet tracking software for businesses can provide visibility into vehicle activity while supporting broader operational analysis.

For example, GPS data can help answer:

Which vehicles travelled the most kilometres?

Which routes generated the longest delays?

Which vehicles spent the most time idle?

Which drivers frequently deviated from planned routes?

When GPS information is combined with fleet analytics, location data becomes an operational intelligence tool rather than simply a map.


Fleet Management Software With Route Optimization

Route efficiency directly affects several fleet KPIs.

A fleet management software with route optimization can help organizations improve:

  • Total kilometres
  • Fuel consumption
  • Delivery time
  • Vehicle utilization
  • Driver productivity
  • Empty kilometres

Route optimization can determine more efficient sequences for multiple deliveries while considering factors such as:

  • Traffic
  • Delivery windows
  • Vehicle capacity
  • Driver availability
  • Customer locations

This can connect route planning directly to measurable fleet performance.


Fleet Analytics Software for Logistics Companies

A large amount of fleet data is only useful when it can be converted into meaningful insights.

Fleet analytics software for logistics companies can help consolidate operational data and identify patterns.

For example:

Fuel KPI declines

→ Analyze vehicles

→ Identify high-consumption assets

→ Compare routes

→ Review idle time

→ Examine driver behaviour

→ Take corrective action

→ Monitor KPI improvement

This is the difference between collecting fleet data and actually using it.


Fleet Analytics Software for Transportation Businesses

Transportation companies often operate complex fleets across multiple routes, regions, and vehicle types.

Fleet analytics software for transportation businesses can help compare performance across:

  • Vehicles
  • Drivers
  • Routes
  • Locations
  • Branches
  • Vehicle categories
  • Time periods

This enables managers to identify high-performing and underperforming areas.

For example, one branch may achieve:

92% vehicle utilization

while another achieves:

68%

Instead of assuming both operations are performing similarly, management can investigate the underlying differences.


Fleet Management KPIs for Logistics Companies

For logistics organizations, KPI tracking should connect fleet activity with customer service and profitability.

A useful logistics KPI framework includes:

Fleet utilization

→ Are vehicles being used productively?

Fuel efficiency

→ How efficiently are vehicles operating?

On-time delivery

→ Are customer commitments being met?

Empty kilometres

→ How much travel is unproductive?

Cost per delivery

→ How much does each delivery cost?

Route adherence

→ Are planned routes being followed?

Vehicle availability

→ How much fleet capacity is operational?

These metrics provide a more complete view of logistics performance.


Fleet Performance KPIs for Fleet Managers

Fleet managers should avoid focusing on a single metric.

For example, maximizing vehicle utilization at the expense of maintenance can create long-term problems.

Similarly, reducing kilometres could negatively affect customer service if deliveries become slower.

Effective fleet performance management balances:

Cost + Productivity + Safety + Service + Asset Health

This means fleet managers should monitor a combination of:

  • Utilization
  • Fuel
  • Maintenance
  • Safety
  • Delivery
  • Driver
  • Route
  • Cost KPIs

Fleet Management Metrics for Logistics Businesses

The most useful fleet management metrics for logistics businesses are those that connect operational activity with business outcomes.

A comprehensive KPI framework can include:

Cost

  • Fuel cost
  • Maintenance cost
  • Cost per kilometre
  • Cost per delivery

Productivity

  • Deliveries per vehicle
  • Deliveries per driver
  • Vehicle utilization
  • Capacity utilization

Operations

  • Vehicle availability
  • Route adherence
  • Empty kilometres
  • Idle time

Service

  • On-time delivery
  • Failed deliveries
  • Average delivery time

Safety

  • Accident rate
  • Speeding events
  • Harsh driving events

Tracking these metrics together gives operations managers a much clearer picture of fleet performance.


How to Build an Effective Fleet KPI Strategy

Tracking 15 KPIs does not mean every manager needs to review all 15 every morning.

A better approach is to create three levels.

Level 1: Executive KPIs

Focus on:

  • Total fleet cost
  • Fleet utilization
  • Fuel efficiency
  • On-time delivery
  • Fleet productivity

Level 2: Operations KPIs

Focus on:

  • Vehicle availability
  • Idle time
  • Route adherence
  • Empty kilometres
  • Driver productivity

Level 3: Diagnostic KPIs

Use detailed metrics to investigate problems:

  • Individual fuel consumption
  • Maintenance history
  • Harsh braking
  • Speeding
  • Downtime
  • Vehicle-level costs

This prevents dashboards from becoming overloaded with information.


Common Mistakes When Tracking Fleet KPIs

Tracking Too Many Metrics

More data does not automatically mean better management.

Choose KPIs that directly support business objectives.

Looking Only at Fleet Averages

Fleet averages can hide individual vehicle problems.

Analyze vehicle-level performance as well.

Ignoring Context

A high number of kilometres isn't necessarily bad if those kilometres generate strong revenue or delivery output.

Measuring Without Taking Action

KPIs are valuable only when they lead to decisions.

Using Outdated Data

Delayed information can make it difficult to respond to operational problems quickly.

Focusing Only on Cost

Reducing costs at the expense of safety or customer service can create larger problems later.


The Future of Fleet KPI Management

Fleet management is moving toward more connected and data-driven operations.

GPS tracking, IoT devices, telematics, cloud platforms, analytics, automation, and AI are making it possible to monitor fleet performance at a much deeper level.

Instead of reviewing performance only at the end of the month, operations teams can increasingly identify issues as they happen.

The future of fleet KPI management is not simply:

"What happened?"

It is increasingly:

"Why did it happen?"

and:

"What should we do next?"

This shift from reporting to actionable intelligence can help fleet managers improve decision-making and operational efficiency.


Frequently Asked Questions

What are fleet management KPIs?

Fleet management KPIs are measurable indicators used to evaluate vehicle utilization, operating costs, fuel efficiency, maintenance, safety, driver productivity, delivery performance, and overall fleet efficiency.

What are the most important fleet management KPIs?

Important KPIs include fleet utilization, vehicle availability, fuel consumption, fuel cost per kilometre, maintenance cost, downtime, on-time delivery, route adherence, idle time, driver productivity, safety rate, empty kilometres, and cost per delivery.

Why are fleet management KPIs important for logistics companies?

They help logistics companies measure fleet productivity, control operating costs, improve delivery performance, identify inefficient vehicles, and make better resource allocation decisions.

How does fleet management software help track KPIs?

Fleet management software can centralize GPS, vehicle, driver, route, fuel, maintenance, and delivery information, making it easier to monitor KPIs through dashboards and analytics.

What is the difference between fleet tracking and fleet management?

Fleet tracking primarily provides visibility into vehicle location and movement. Fleet management covers a broader range of activities, including tracking, maintenance, fuel, driver management, route optimization, utilization, and performance analytics.

Can GPS tracking improve fleet performance?

GPS tracking provides visibility into vehicle activity, routes, distance, idle time, and deviations. When combined with analytics, this information can help identify opportunities to improve fleet performance.

What KPIs should a fleet manager monitor daily?

Daily monitoring can focus on vehicle availability, fleet utilization, active vehicles, idle time, route adherence, delivery status, fuel alerts, and safety events. More strategic cost and maintenance KPIs can be reviewed weekly or monthly.

How can fleet analytics software improve decision-making?

Fleet analytics software can consolidate data from multiple operational areas and help managers identify trends, anomalies, inefficient assets, and opportunities for improvement.


Conclusion

Effective fleet management starts with visibility, but visibility alone isn't enough.

Operations managers need measurable indicators that show whether vehicles, drivers, routes, and resources are producing the expected results.

The right fleet management KPIs provide that foundation.

From fleet utilization and fuel consumption to maintenance, route adherence, driver productivity, safety, and cost per delivery, each metric reveals a different part of fleet performance.

When these metrics are connected through fleet management software, GPS fleet tracking, route optimization, and fleet analytics, organizations can move from reactive fleet management to proactive operational improvement.

The ultimate goal isn't to create the biggest dashboard.

It is to create a fleet that is:

More productive. More efficient. Safer. More predictable. And more profitable.

For logistics and transportation businesses, consistently measuring the right fleet metrics can turn everyday operational data into a competitive advantage.

Share
  • Fleet Performance

    9 Ways Fleet Analytics Improves Business Decisions

    Fleet analytics turns vehicle and operational data into clear insights that improve decision-making. From cost control and route efficiency to predictive maintenance and driver performance, see how fleet intelligence helps logistics businesses operate smarter.

    19 Aug 20264 min
  • Fleet Management Software

    What Is Fleet Management Software and How Does It Work?

    Fleet management software is a centralized platform that monitors vehicles, drivers, fuel, maintenance, routes and safety. It turns GPS & telematics data into real-time insights, alerts and analytics — helping fleets reduce costs, improve utilization and make smarter decisions.

    11 Aug 20264 min
  • FMCG & Distribution

    Fleet Management Software for FMCG Distribution

    Fleet management software for FMCG helps distributors optimize delivery routes, reduce fuel costs, improve vehicle utilization, track deliveries, and streamline daily distribution operations.

    31 Aug 20262 min

See KO Fleetz running on your fleet

A 30-minute walkthrough using your vehicles, your routes and the problems you are actually trying to solve.