Skip to content
Fleet Analytics

The Cost-to-Serve Gap: Where Is Your Fleet Margin Going?

Fleet margins can disappear through small, hidden costs across fuel, maintenance, idle time, routes, and trips. Learn how to identify the cost-to-serve gap and protect profitability.

KO Fleetz Admin6 October 20263 min read
The Cost-to-Serve Gap: Where Is Your Fleet Margin Going?
On this page

Are Invisible Costs Eating Into Your Fleet Margin?

A fleet can look profitable on paper while quietly losing margin through costs that are difficult to see.

Fuel inefficiency.
Unplanned maintenance.
Empty kilometres.
Vehicle idle time.
Route deviations.
Underutilized assets.
Unexpected trip expenses.

Individually, these costs may look small.

Together, they can create a significant cost-to-serve gap.

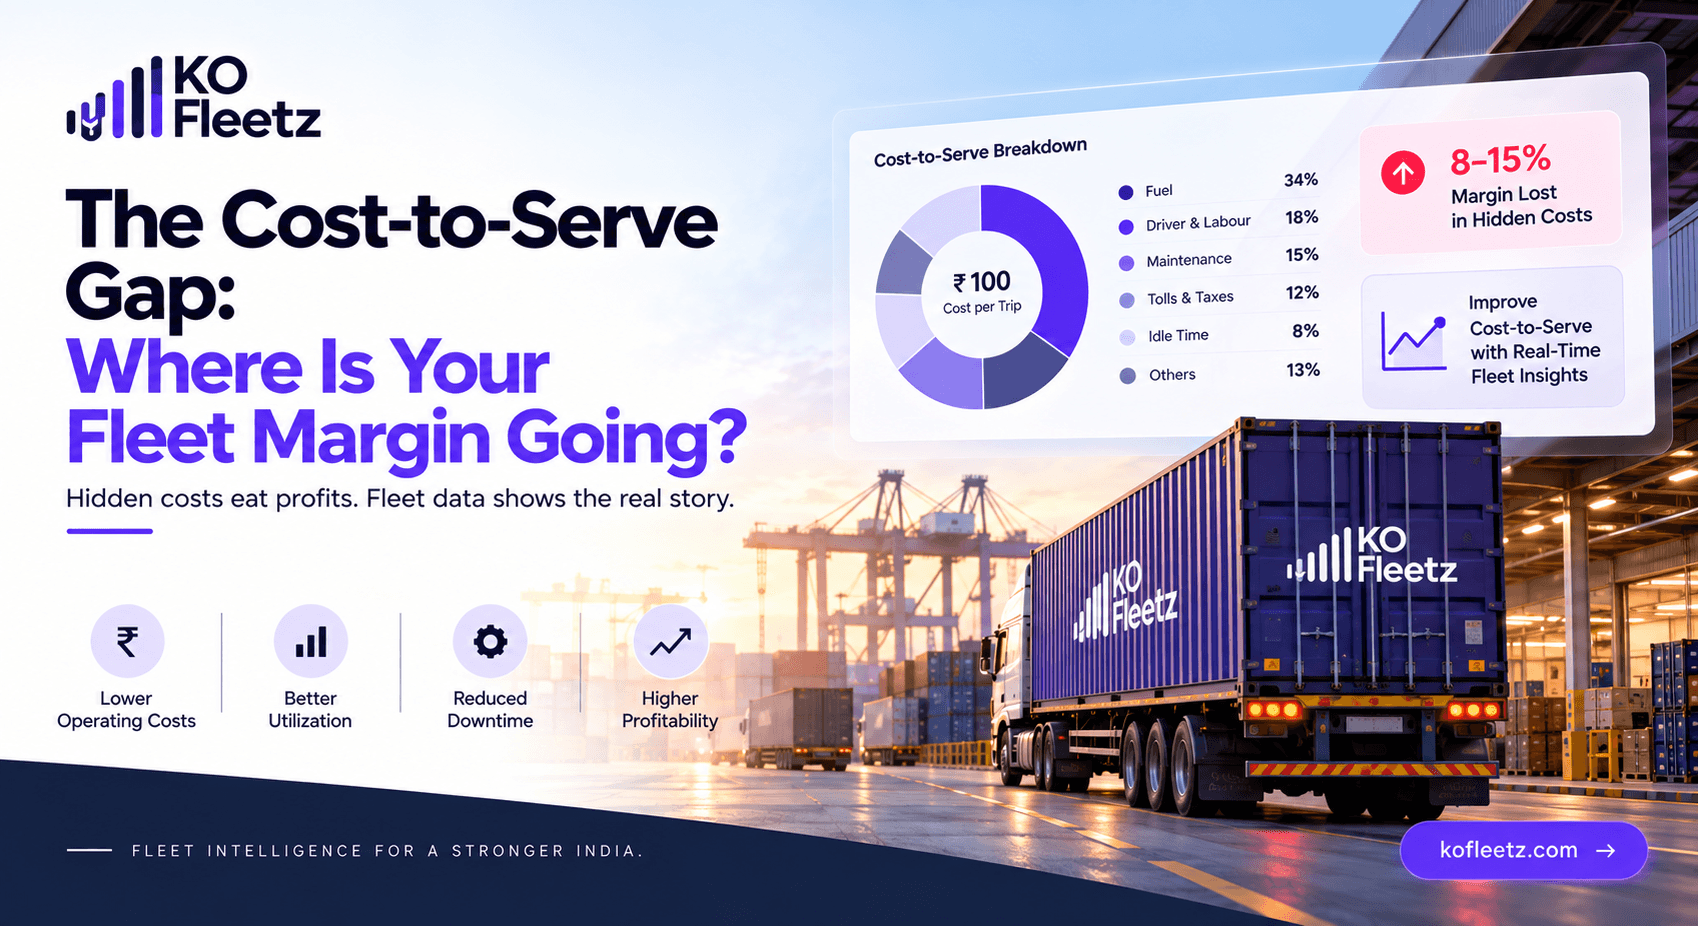
Industry discussions often cite potential margin leakage in the 8–15% range, but the actual impact varies significantly by fleet, route, vehicle type, and operating model.

The important question is:

Do you know exactly what each trip, vehicle, and customer is costing you?

What Is the Cost-to-Serve Gap?

The cost-to-serve gap is the difference between the cost a business expects to incur for delivering a service and the actual cost of serving that customer, route, trip, or shipment.

For fleet operators, the gap can come from multiple sources:

  • Fuel consumption
  • Maintenance
  • Driver costs
  • Empty kilometres
  • Toll and route expenses
  • Vehicle downtime
  • Excessive idling
  • Poor vehicle utilization
  • Unplanned repairs
  • Inefficient routes

If these costs are not connected, the real profitability of a trip can remain unclear.

Where Does the Hidden Cost Come From?

1. Fuel Inefficiency

Two vehicles may travel similar distances but consume different amounts of fuel.

Without vehicle-level fuel analytics, the difference can easily go unnoticed.

2. Empty Kilometres

A vehicle travelling without a productive load still consumes fuel, time, and maintenance resources.

Reducing unnecessary empty travel can directly improve fleet efficiency.

3. Vehicle Downtime

A vehicle that is unavailable cannot generate revenue while its fixed costs continue.

Maintenance planning and vehicle utilization therefore have a direct impact on fleet profitability.

4. Inefficient Routes

Longer routes increase fuel consumption, driver hours, vehicle wear, and delivery time.

Small route inefficiencies can become significant when repeated across hundreds of trips.

5. Underutilized Assets

An expensive vehicle that spends too much time idle can increase the cost of every productive trip performed by the fleet.

How Can Fleet Operators Close the Gap?

The first step is visibility.

Businesses need to connect:

Trip + Vehicle + Fuel + Driver + Maintenance + Distance + Expenses

Once these data points are connected, managers can calculate more meaningful metrics such as:

  • Cost per trip
  • Cost per kilometre
  • Fuel cost per trip
  • Vehicle operating cost
  • Cost per delivery
  • Vehicle utilization
  • Customer-level cost to serve

This turns fleet data into a profitability tool.

From Cost Tracking to Cost Control

Traditional fleet reporting often answers:

“How much did we spend?”

Modern fleet analytics should answer:

“Why did we spend it?”

And more importantly:

“What can we change?”

That shift helps fleet managers move from reporting costs to actively controlling them.

How KO Fleetz Helps

KO Fleetz connects fleet operations across vehicles, trips, fuel, maintenance, drivers, expenses, freight, and analytics.

This gives businesses a connected view of the costs behind transportation operations.

Instead of analyzing fuel, maintenance, and trips separately, managers can evaluate how these factors affect overall fleet performance and profitability.

The Bottom Line

The biggest fleet cost may not be a single large expense.

It can be the accumulation of small invisible costs repeated across thousands of kilometres and trips.

The cost-to-serve gap becomes easier to close when businesses can see exactly where operational costs are coming from.

Know the cost. Find the gap. Protect the margin.

New Blog Live

Most fleets don't lose margin in one big event. They lose it in small costs that remain invisible.

Read the new KO Fleetz blog to understand where your fleet's cost-to-serve gap may be forming and how data-driven fleet management can help close it.

Share

See KO Fleetz running on your fleet

A 30-minute walkthrough using your vehicles, your routes and the problems you are actually trying to solve.