The Cost-to-Serve Gap: Where Is Your Fleet Margin Going?
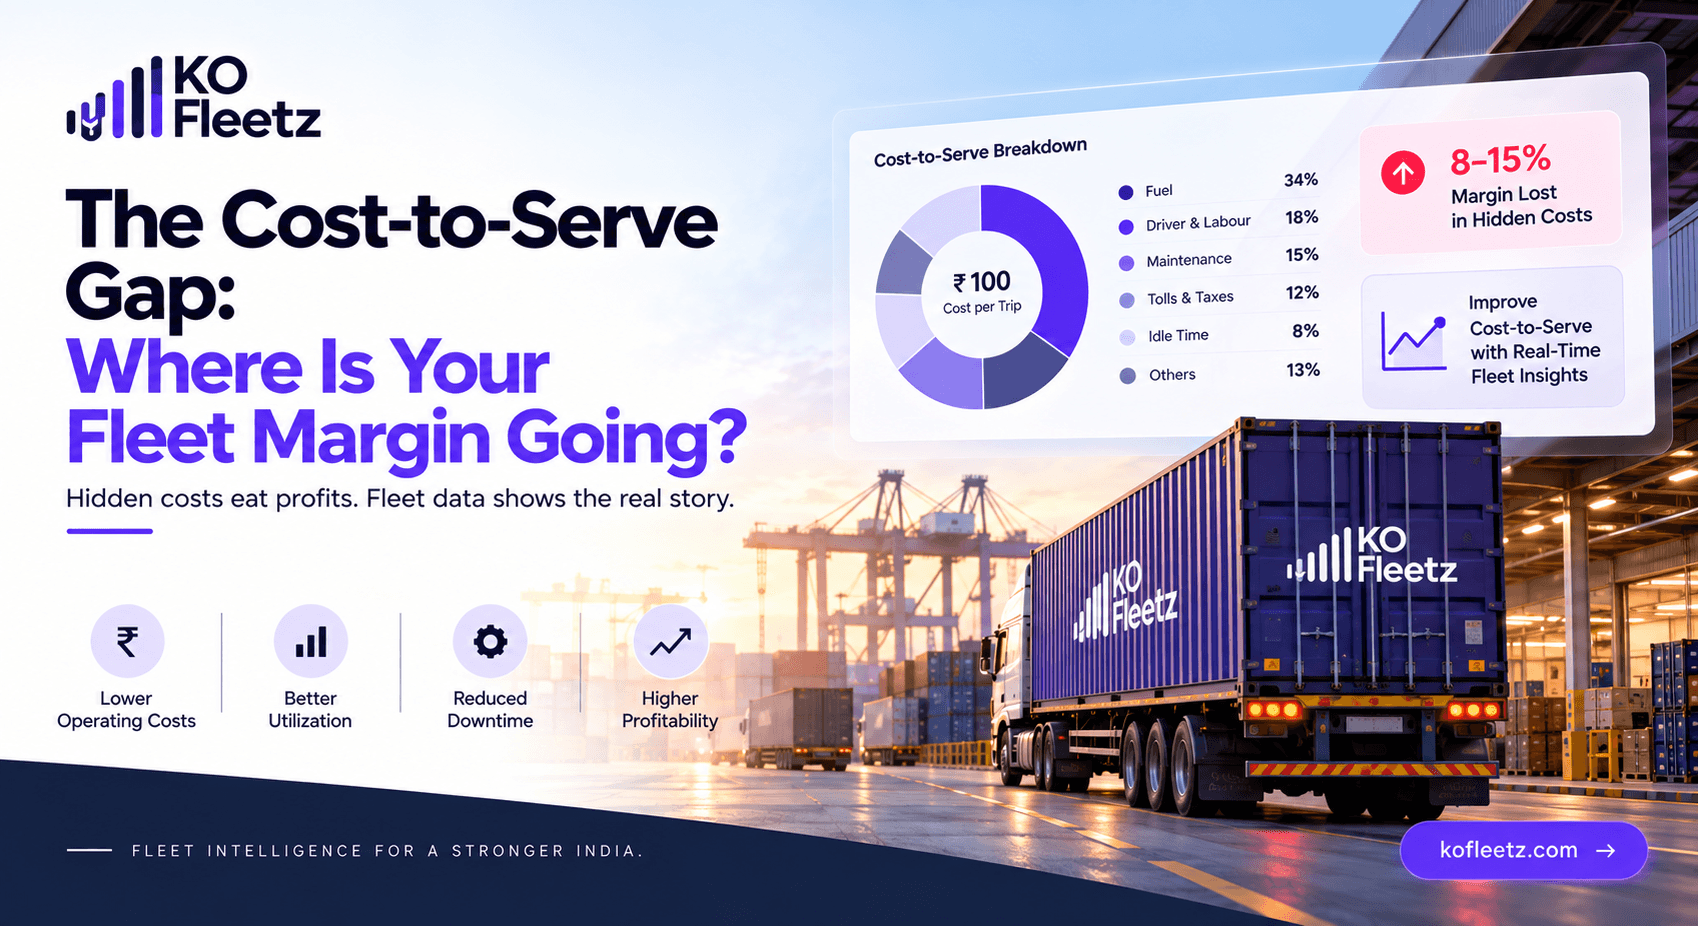
Fleet margins can disappear through small, hidden costs across fuel, maintenance, idle time, routes, and trips. Learn how to identify the cost-to-serve gap and protect profitability.
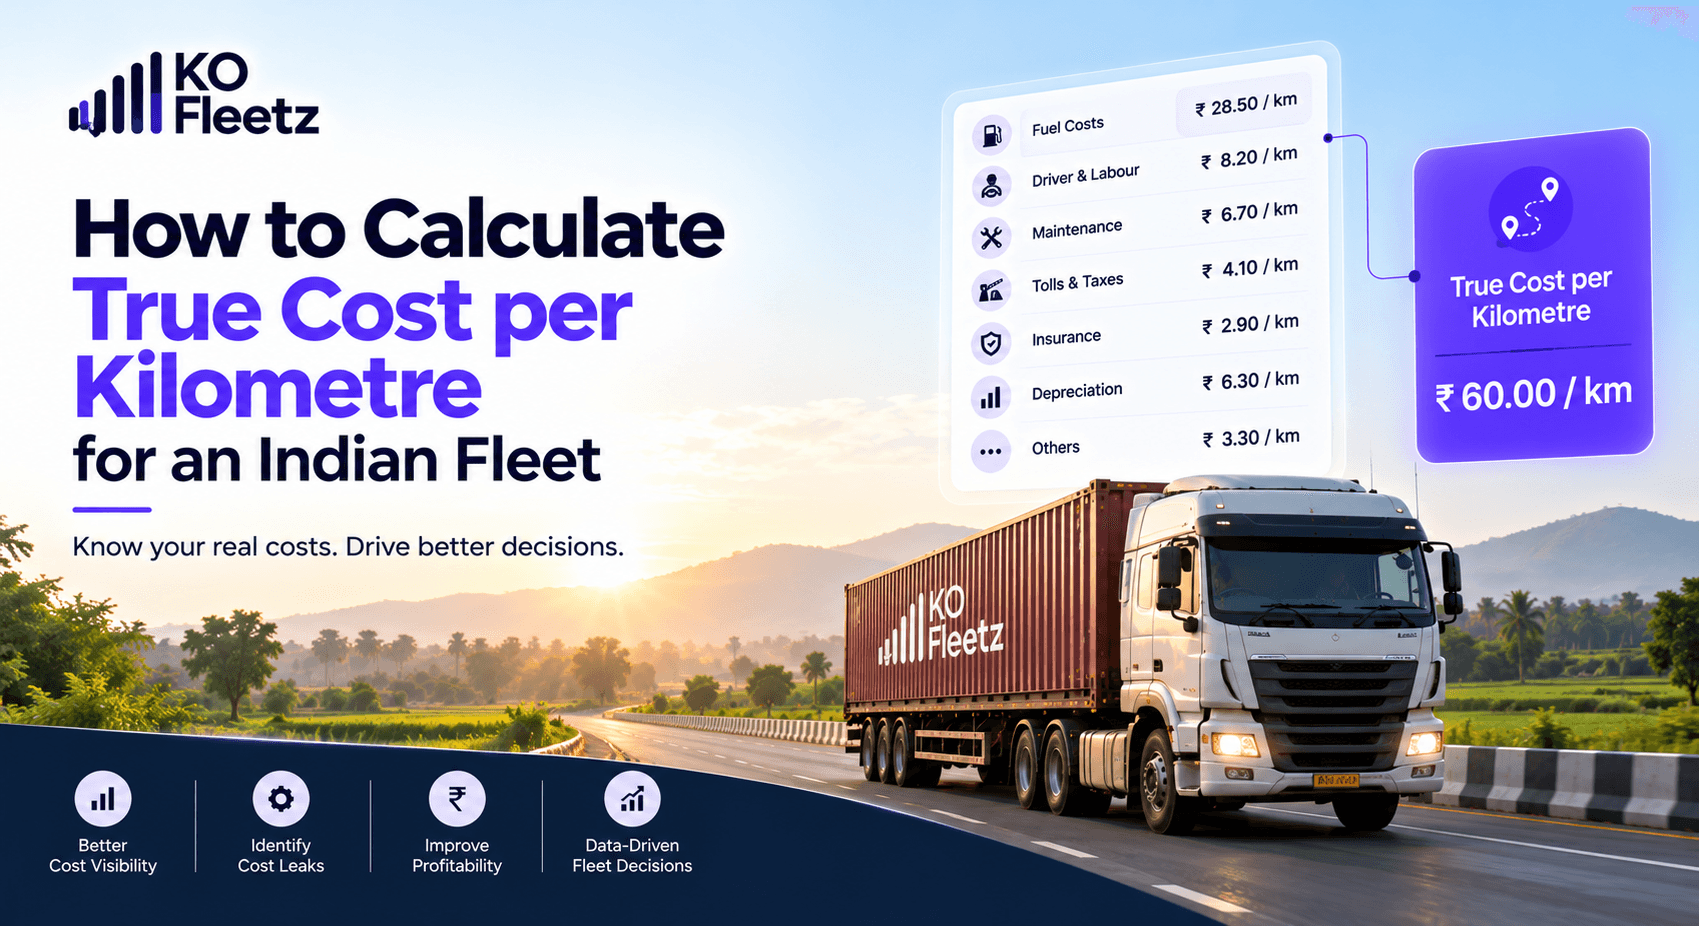
Fuel is only one part of fleet operating costs. Learn how Indian fleet owners can calculate the true cost per kilometre and identify hidden expenses affecting profitability.

A commercial vehicle may travel hundreds of kilometres every day, but distance alone doesn't tell you whether the trip is profitable.
Fuel, tolls, driver salaries, maintenance, tyres, insurance, depreciation, and empty return trips all contribute to the actual cost of operating a fleet.
If you calculate your fleet cost per kilometre using fuel expenses alone, you may underestimate the real cost of transportation and quote customers prices that reduce your margins.
For Indian fleet owners, logistics managers, and transport businesses, calculating the true cost per kilometre helps improve pricing decisions, control expenses, and identify unprofitable routes.
Fleet cost per kilometre is the total cost of operating a vehicle or fleet divided by the total kilometres travelled during a specific period.
It helps businesses understand how much they spend to operate each vehicle for every kilometre covered.
Formula:
Cost per kilometre = Total fleet operating costs ÷ Total kilometres travelled
For example, if a truck incurs ₹1,20,000 in operating costs over 6,000 kilometres in a month:
₹1,20,000 ÷ 6,000 = ₹20 per kilometre
This figure represents the vehicle's operating cost for the period, provided all relevant expenses are included.
To calculate the true cost per kilometre, include both direct and indirect operating expenses.
Fuel is often one of the largest expenses for commercial fleets.
Include diesel or other fuel purchases, fuel consumption, and any additional fuel-related costs.
Calculation:
Fuel cost per km = Total fuel expense ÷ Total kilometres travelled
Monitor fuel efficiency, excessive idling, unusual consumption, and route deviations to understand why fuel costs change.
Include FASTag deductions and other applicable toll charges.
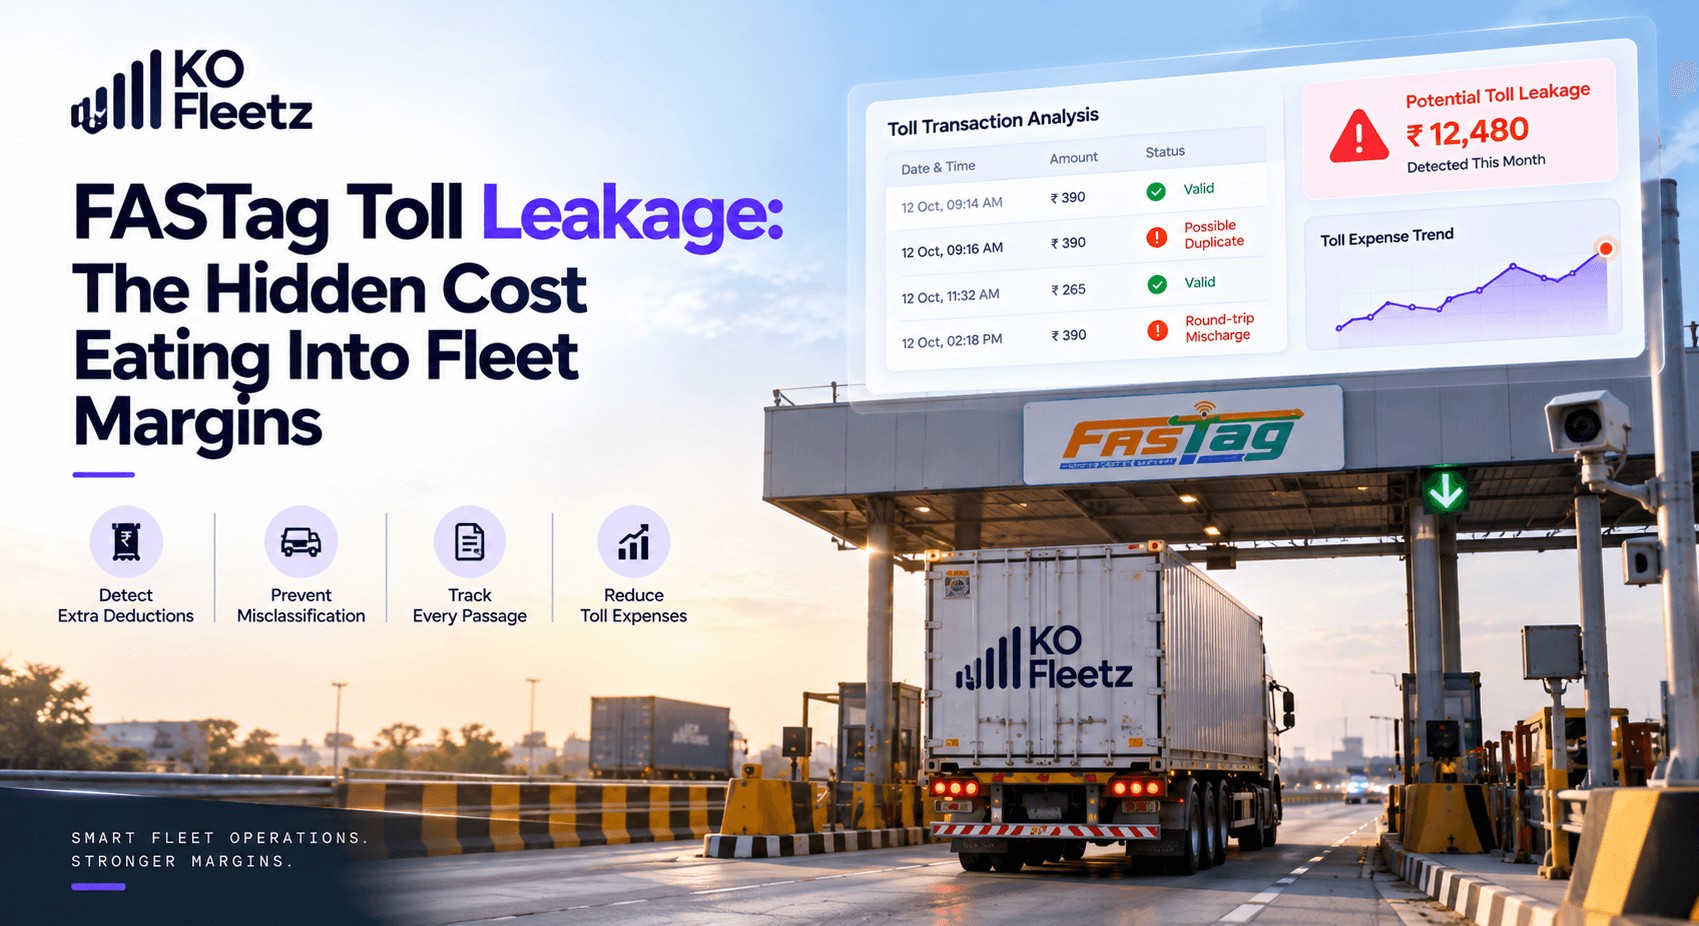
Review toll expenses by vehicle and trip to identify duplicate deductions, unexpected charges, and expensive routes.
Include driver salaries, trip allowances, overtime, and other relevant employee costs.
For accurate calculations, allocate monthly driver expenses across the kilometres travelled during the same period.
Include routine servicing, repairs, spare parts, and labour costs.
Tracking maintenance expenses by vehicle helps identify assets that cost more to operate than expected.
Tyres, lubricants, and other consumables contribute to long-term operating costs.
For example, if a tyre set costs ₹40,000 and lasts 40,000 kilometres, its estimated tyre cost is ₹1 per kilometre.
Use actual replacement and usage records wherever possible.
Include commercial vehicle insurance, applicable permits, fitness certification, and other recurring compliance expenses.
Allocate annual expenses across the months or kilometres covered by your calculation period.
Vehicles lose value over time, while financed vehicles may incur interest expenses.
Include depreciation or an appropriate ownership-cost allocation. If financing interest is included separately, avoid counting the same cost twice.
Empty return trips, unnecessary detours, and underutilised vehicles can increase the cost of delivering each kilometre of productive work.
Track both total kilometres and loaded kilometres to understand the impact of unproductive travel.
Select a consistent period, such as one month, one quarter, or one year.
Use the same period for all expenses and distance records.
Use odometer readings or verified GPS tracking data to determine the total distance travelled by each vehicle.
Separate loaded and empty kilometres if you want to measure delivery efficiency.
Combine fuel, tolls, driver costs, maintenance, tyres, insurance, permits, depreciation, and other relevant expenses.
Use actual records wherever possible rather than estimates.
Divide total operating costs by total kilometres travelled.
Calculate the cost per kilometre for individual vehicles, routes, and trips.
This helps identify high-cost vehicles, inefficient routes, and differences in operating performance.
Consider a commercial truck operating in India with the following illustrative monthly expenses.
| Expense Category | Monthly Cost |
|---|---|
| Diesel | ₹60,000 |
| Tolls and FASTag | ₹12,000 |
| Driver salary and allowances | ₹18,000 |
| Maintenance and repairs | ₹6,000 |
| Tyres and consumables | ₹4,000 |
| Insurance and permits allocation | ₹3,000 |
| Depreciation and financing allocation | ₹12,000 |
| Total operating cost | ₹1,15,000 |
Assume the truck travels 5,000 kilometres per month.
Cost per kilometre = ₹1,15,000 ÷ 5,000
True cost per kilometre = ₹23
In this example, the truck costs ₹23 for every kilometre travelled, based on the listed expenses.
If the business charges a customer ₹25 per kilometre, the apparent difference is only ₹2 per kilometre before considering any excluded overheads, taxes, or other applicable charges.
This is why understanding the complete cost structure is essential before setting transportation rates.
Note: These figures are illustrative, not industry averages. Actual costs vary by vehicle type, route, fuel efficiency, utilisation, and operating conditions.
These two metrics answer different business questions.
| Metric | Formula | What It Tells You |
|---|---|---|
| Cost per kilometre | Total operating costs ÷ Total kilometres | Average cost of vehicle movement |
| Cost per loaded kilometre | Total operating costs ÷ Loaded kilometres | Cost relative to productive, loaded distance |
Suppose a truck travels 5,000 km in a month, but only 3,500 km are loaded kilometres.
If its monthly operating cost is ₹1,15,000:
The second metric highlights how empty running can affect the economics of freight transportation.
Once you establish a baseline, focus on the biggest cost drivers.
A consistent measurement process makes it easier to see whether these improvements are actually reducing operating costs.
Spreadsheets can work for small operations, but analysing hundreds of vehicles and thousands of trips manually becomes increasingly difficult.
Fleet management software helps centralise operational information, making it easier to connect vehicle movement with fuel consumption, toll expenses, maintenance records, and trip costs.
With a connected platform such as KO Fleetz, fleet operators can use fleet tracking, trip management, fuel management, maintenance information, and analytics to improve visibility into operating expenses.
This can help businesses:
The goal is not simply to collect more data. It is to turn that data into decisions that improve fleet efficiency and profitability.
There is no single benchmark that applies to every truck. Cost depends on vehicle size, fuel efficiency, route, tolls, maintenance, driver expenses, utilisation, and ownership costs. Compare similar vehicles operating under similar conditions.
No. Fuel is only one component. A more complete calculation includes tolls, salaries, maintenance, tyres, insurance, permits, depreciation, and other relevant operating costs.
Monthly calculations are a useful starting point for most fleets. High-volume operations may benefit from more frequent monitoring and trip-level analysis.
Calculate total operating expenses and total kilometres for each vehicle individually. You can also calculate a fleet-wide figure by dividing combined expenses by combined kilometres, provided the same cost definitions and period are used.
Yes. Fleet management software can improve visibility into fuel, routes, tolls, maintenance, and vehicle utilisation. The resulting insights help managers identify opportunities to reduce unnecessary costs.
Every kilometre has a cost, but not every fleet measures it accurately.
When businesses overlook tolls, maintenance, depreciation, empty running, and other expenses, they risk underpricing trips and weakening their margins.
Start by calculating your complete fleet cost per kilometre. Then track how that figure changes across vehicles, routes, and reporting periods.
Turn fleet data into better cost decisions with KO Fleetz.
Bring fleet tracking, trip information, fuel management, maintenance visibility, and analytics into one connected platform. Understand where your money goes, identify opportunities to control expenses, and make more informed decisions about fleet profitability.
Explore KO Fleetz and book a demo to discover smarter fleet cost management.

Fleet margins can disappear through small, hidden costs across fuel, maintenance, idle time, routes, and trips. Learn how to identify the cost-to-serve gap and protect profitability.

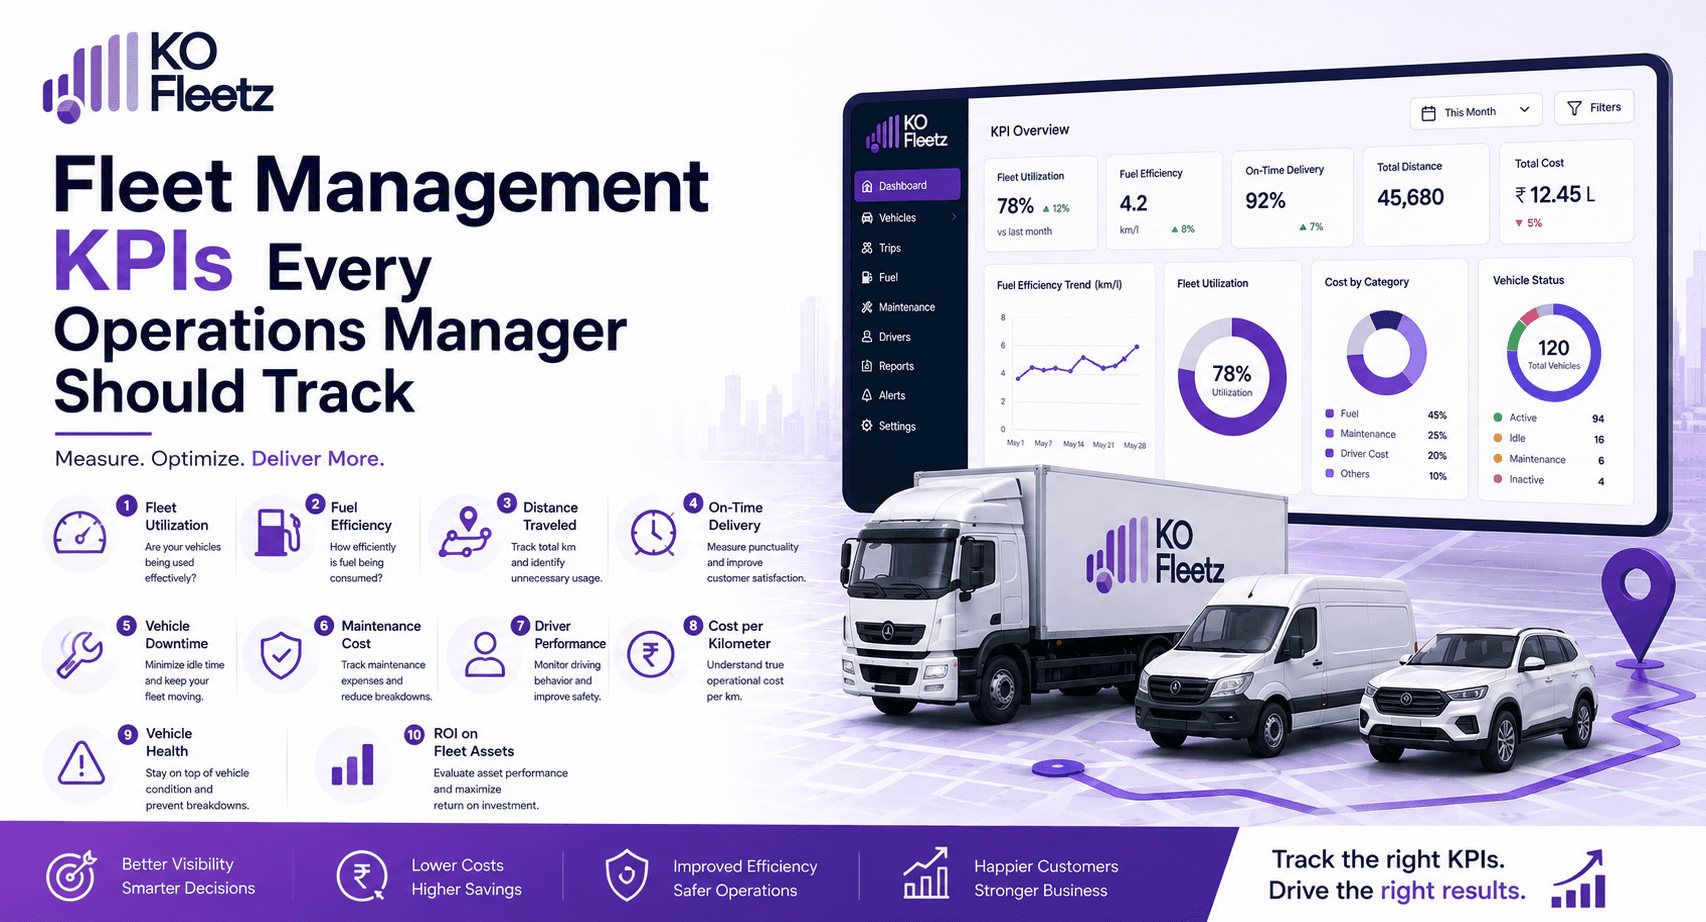
Fleet management KPIs help operations managers measure utilization, fuel use, maintenance, safety, and delivery performance. Track these 15 key metrics to improve efficiency, control costs, and make better decisions with data.

Toll overpayments and FASTag discrepancies can quietly increase fleet operating costs. Learn how automated toll reconciliation can help logistics businesses detect leakage and control route costs.
A 30-minute walkthrough using your vehicles, your routes and the problems you are actually trying to solve.