Skip to content
Fleet Performance

Fleet Utilization: How to Measure and Improve It

Fleet utilization shows how effectively your vehicles are being used. Learn how to measure it correctly and apply 10 practical ways to improve vehicle utilization, fleet efficiency, and asset utilization without adding more vehicles.

KO Fleetz Admin17 August 202617 min read
Fleet Utilization: How to Measure and Improve It
On this page

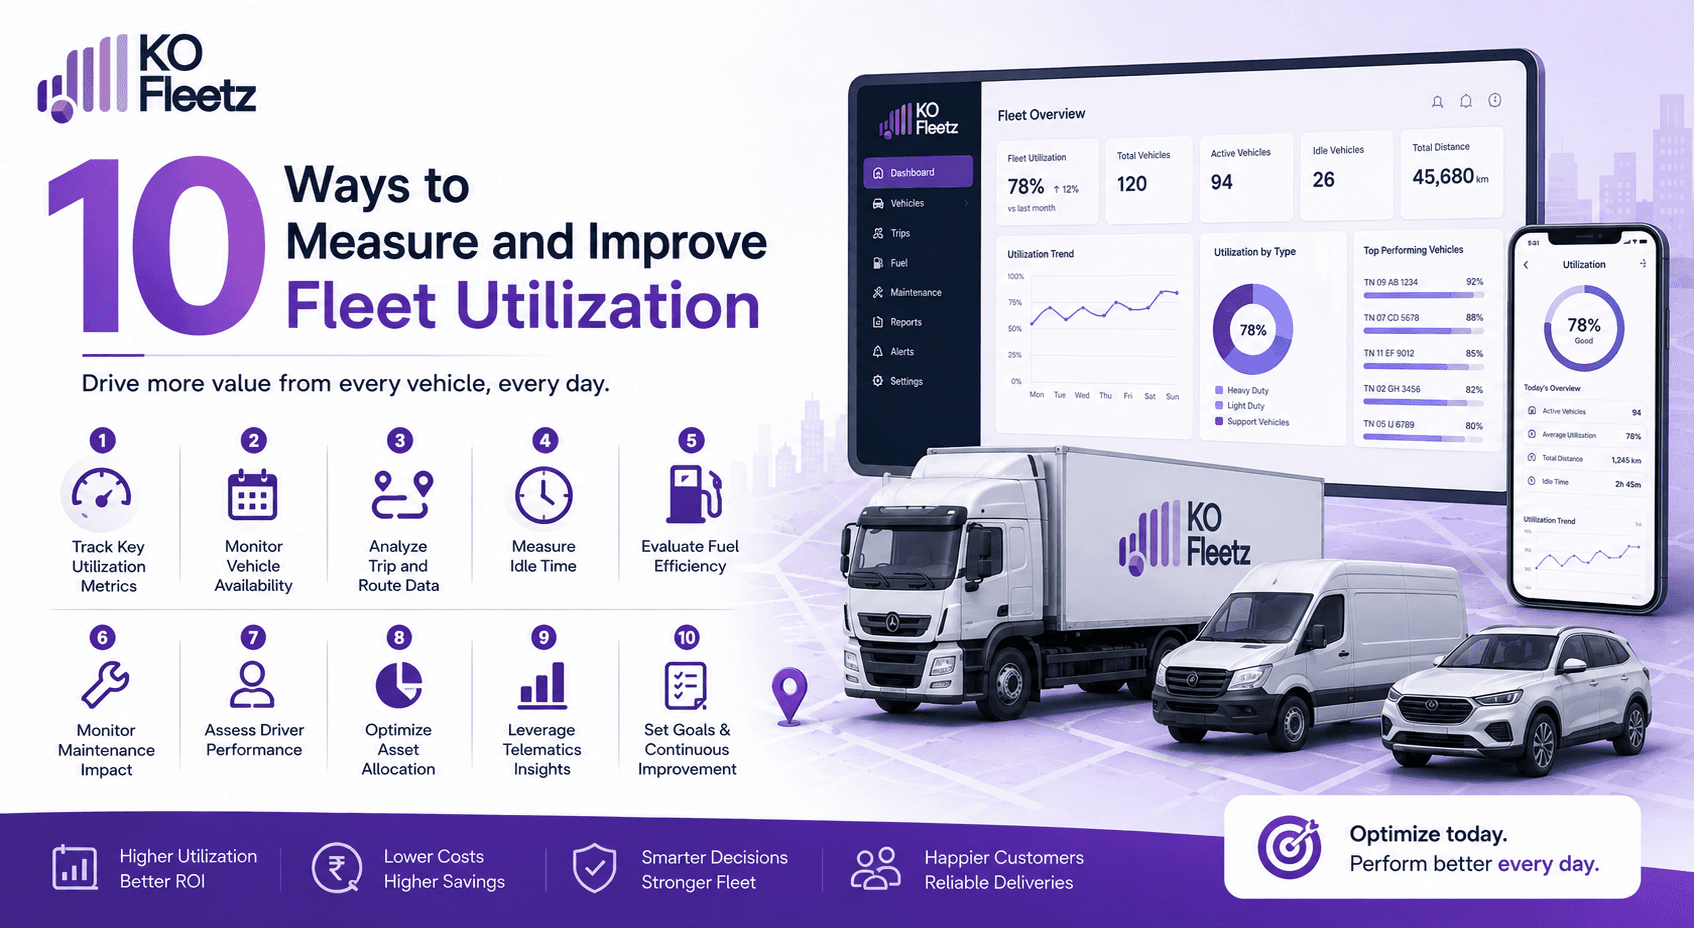
10 Ways to Measure and Improve Fleet Utilization

Introduction

A fleet can have the right number of vehicles, experienced drivers, and a strong operational process, yet still perform below its potential.

One common reason is low fleet utilization.

A vehicle that spends too much time parked, travels with unused capacity, makes too few trips, or operates for only a small portion of the available working day represents an underused business asset.

For fleet-intensive businesses, this can have a direct impact on profitability.

Vehicles involve costs whether they are moving or sitting in a yard. Finance payments, insurance, depreciation, maintenance, registration, and other ownership costs continue even when an asset is not generating productive output.

That makes fleet utilization an important metric for fleet managers and operations teams.

The goal is not simply to keep every vehicle moving all the time.

Instead, effective fleet utilization means using the right vehicle, for the right amount of time, on the right work, while maintaining safety, service quality, and operational efficiency.

In this guide, we'll explain what fleet utilization means, how to measure it, which KPIs matter, why vehicles become underutilized, and 10 practical ways to improve fleet utilization and fleet productivity.


What Is Fleet Utilization?

Fleet utilization measures how effectively a company's available vehicles are being used to perform productive work.

It helps answer a fundamental question:

How much value are we getting from the fleet assets we already own or operate?

A vehicle may be considered highly utilized when it consistently contributes to productive operations without excessive idle time or unused capacity.

Fleet utilization can be evaluated using different factors, including:

  • Operating hours
  • Vehicle availability
  • Distance travelled
  • Number of trips
  • Number of deliveries
  • Load capacity
  • Revenue-generating activity
  • Idle time
  • Vehicle downtime
  • Driver working hours

Because different industries operate differently, there is no single utilization metric that works for every fleet.

A logistics company may focus on deliveries and kilometres.

A construction fleet may focus on equipment operating hours.

A field-service company may focus on jobs completed per vehicle.

A corporate transportation fleet may focus on passenger trips and operating hours.

Therefore, fleet utilization should always be measured against the actual business purpose of each vehicle.


Fleet Utilization vs Vehicle Utilization

The terms fleet utilization and vehicle utilization are closely related but can be used at different levels.

Vehicle Utilization

Vehicle utilization looks at the performance of an individual vehicle.

For example:

  • Vehicle A operated 9 hours
  • Vehicle B operated 4 hours
  • Vehicle C operated 7 hours

This helps identify specific underused or overused vehicles.

Fleet Utilization

[Fleet utilization(https://kofleetz.com/features/fleet-utilization/) looks at the performance of the fleet as a whole.

For example:

A company operates 100 vehicles, but only 72 are regularly being used for productive operations.

Fleet-level analysis can reveal whether the company has excess capacity or whether vehicles are being distributed inefficiently.

Why both matter

Fleet-level metrics can hide individual vehicle problems.

A fleet may appear healthy overall while several vehicles remain consistently underutilized.

That is why fleet managers should analyze both:

Fleet-level performance + Individual vehicle performance


Why Fleet Utilization Matters

Vehicles are expensive assets.

Even when they are not operating, organizations may continue to pay for:

  • Vehicle financing
  • Insurance
  • Depreciation
  • Registration
  • Parking or storage
  • Maintenance
  • Taxes
  • Administrative costs

If a vehicle generates productive output only occasionally, its cost per productive trip can become high.

Improving fleet utilization can help organizations:

  • Increase asset productivity
  • Reduce unnecessary fleet size
  • Improve vehicle availability
  • Increase revenue-generating activity
  • Reduce idle assets
  • Improve fleet efficiency
  • Delay unnecessary vehicle purchases
  • Improve return on fleet investment

The objective is not always to reduce the number of vehicles.

Sometimes the better decision is to improve how existing vehicles are assigned and operated.


How to Calculate Fleet Utilization

There are several ways to calculate utilization depending on the business model.

1. Time-Based Utilization

A simple utilization calculation compares productive operating hours with available hours.

Fleet Utilization % = Productive Operating Hours ÷ Available Operating Hours × 100

Example

Suppose a vehicle is available for:

10 hours per day

It performs productive work for:

7 hours

Then:

7 ÷ 10 × 100 = 70% utilization

This means the vehicle had a 70% productive utilization rate during the measured period.


2. Availability-Based Utilization

Another approach compares vehicles actively being used with the total available fleet.

Fleet Utilization % = Vehicles in Productive Operation ÷ Total Available Vehicles × 100

For example:

  • Total fleet: 100 vehicles
  • Vehicles actively assigned to productive work: 80

80 ÷ 100 × 100 = 80%

This provides a high-level view of how much of the fleet is actively being used.


3. Distance-Based Utilization

For certain fleets, kilometres can be useful.

You can compare actual kilometres travelled against an expected or planned operating range.

However, distance alone should not be treated as a complete utilization measure.

A vehicle travelling 300 km does not necessarily mean it was more productive than one travelling 200 km.

The 200 km vehicle could have completed more deliveries or generated more revenue.

This is why distance should be combined with productivity metrics.


10 Ways to Measure and Improve Fleet Utilization

1. Measure Vehicle Operating Hours

One of the simplest ways to understand utilization is to measure how long vehicles are actually operating.

Compare:

Available hours vs productive operating hours

For example:

MetricVehicle A
Available hours10
Operating hours8
Idle hours2
Utilization80%

This immediately highlights whether the vehicle is being used effectively.

Tracking this information across the fleet can identify vehicles that consistently operate below expected levels.

What to look for

If one vehicle consistently operates for 3 hours while similar vehicles operate for 8 hours, investigate why.

Possible reasons could include:

  • Low demand
  • Poor vehicle assignment
  • Driver availability
  • Maintenance downtime
  • Poor route planning
  • Excess fleet capacity

2. Track Idle Time

A vehicle that is technically running but not performing productive work can still represent wasted capacity.

Idle time may occur because of:

  • Traffic
  • Waiting for loading
  • Waiting for customers
  • Driver breaks
  • Poor scheduling
  • Long gaps between jobs
  • Operational delays

Tracking idle time helps fleet managers distinguish between vehicle movement and productive utilization.

A vehicle travelling for eight hours is not necessarily productive for eight hours.

For example:

8 hours operating

minus

2 hours waiting

equals

6 hours productive activity

This distinction is important when measuring fleet efficiency.


3. Measure Trips and Deliveries Per Vehicle

For delivery and logistics fleets, one of the most useful measures is the amount of work completed by each vehicle.

Track metrics such as:

  • Deliveries per vehicle
  • Trips per vehicle
  • Jobs completed per vehicle
  • Stops per route
  • Orders completed per shift

For example:

Vehicle A: 15 deliveries/day

Vehicle B: 8 deliveries/day

Vehicle C: 14 deliveries/day

If all three vehicles operate under similar conditions, Vehicle B may require further investigation.

It could be experiencing:

  • Poor route allocation
  • Lower demand
  • Longer service times
  • Driver productivity issues
  • Geographic inefficiencies

4. Monitor Vehicle Downtime

A vehicle cannot contribute to fleet productivity when it is unavailable.

Downtime can result from:

  • Preventive maintenance
  • Unexpected breakdowns
  • Accidents
  • Repairs
  • Inspection requirements
  • Parts shortages

Track:

Total downtime per vehicle

and

Downtime as a percentage of available operating time

A vehicle that frequently requires repairs may appear underutilized when the real problem is maintenance reliability.

This distinction is critical.

You should not solve a maintenance problem by simply assigning more work to the vehicle.


5. Measure Capacity Utilization

A vehicle can be moving and still be underutilized.

Consider a truck with a payload capacity of:

10 tonnes

If it regularly carries:

4 tonnes

then only a portion of its available capacity is being used.

This is an example of asset utilization.

Capacity utilization can be measured using:

Actual Load ÷ Available Capacity × 100

In the example:

4 ÷ 10 × 100 = 40%

Low capacity utilization can indicate opportunities to:

  • Consolidate shipments
  • Improve dispatch planning
  • Select smaller vehicles
  • Combine delivery orders
  • Adjust vehicle allocation

This can improve fleet productivity without increasing fleet size.


6. Analyze Vehicle Utilization by Day and Time

Fleet utilization is rarely consistent throughout the day.

You may discover that:

  • Vehicles are heavily used in the morning
  • Demand falls during the afternoon
  • Certain weekdays have low demand
  • Weekends have excess capacity
  • Certain vehicles are consistently underused

Analyzing utilization by:

  • Hour
  • Day
  • Week
  • Month
  • Location
  • Vehicle type

can reveal patterns that are difficult to see from monthly averages.

For example:

A fleet may show 75% monthly utilization.

That sounds healthy.

But detailed analysis might reveal:

90% utilization Monday–Thursday

and

45% utilization Friday–Sunday

That could indicate an opportunity to adjust schedules, vehicle allocation, or fleet size.


7. Compare Utilization Across Vehicle Types

Not every vehicle is designed for the same task.

A business may operate:

  • Light commercial vehicles
  • Vans
  • Pickup trucks
  • Medium-duty trucks
  • Heavy trucks
  • Specialized vehicles

Comparing utilization across vehicle categories can identify mismatches between assets and operational requirements.

For example:

A large truck may be used for deliveries that could be completed more efficiently using a smaller vehicle.

The result could be:

  • Lower capacity utilization
  • Higher fuel consumption
  • Higher operating cost

Matching vehicle type to workload is therefore an important part of improving fleet efficiency.


8. Use Route Optimization to Increase Productive Time

Poor routing can reduce vehicle utilization.

A vehicle may spend significant time:

  • Travelling between distant stops
  • Backtracking
  • Waiting in traffic
  • Returning empty
  • Covering inefficient routes

Route optimization can help organize deliveries and jobs more efficiently.

Better routing can increase the amount of productive work completed during the same operating period.

For example:

Poor route

10 hours → 6 productive hours

Optimized route

10 hours → 8 productive hours

The vehicle has not necessarily driven faster.

The improvement comes from reducing wasted travel and improving stop sequencing.


9. Improve Vehicle and Job Allocation

Fleet utilization depends heavily on assigning the right vehicle to the right job.

Consider a company with:

  • 10 small vans
  • 10 medium trucks
  • 10 heavy trucks

If heavy trucks are regularly assigned to small loads, the fleet may technically be busy but operationally inefficient.

Effective allocation considers:

  • Load size
  • Vehicle capacity
  • Delivery location
  • Route distance
  • Customer requirements
  • Vehicle availability
  • Delivery priority

This improves asset utilization by ensuring each vehicle performs work that matches its capabilities.


10. Use Fleet Analytics for Continuous Improvement

Fleet utilization should not be treated as a one-time calculation.

It should be monitored continuously.

Fleet analytics can help managers create dashboards showing:

  • Vehicle utilization
  • Fleet availability
  • Idle time
  • Downtime
  • Kilometres travelled
  • Fuel consumption
  • Trips
  • Deliveries
  • Capacity utilization
  • Cost per vehicle
  • Driver productivity

This allows managers to identify trends rather than relying on assumptions.

For example:

Vehicle utilization drops

Investigate vehicle activity

Identify excessive idle time

Analyze route and job assignment

Optimize schedule

Measure utilization again

This creates a continuous improvement cycle.


What Causes Low Fleet Utilization?

Understanding the reason behind low utilization is more important than simply identifying the number.

Common causes include:

Excess Vehicles

The fleet may be larger than current operational demand requires.

Poor Scheduling

Vehicles may be available but not assigned efficiently.

Uneven Work Distribution

Some vehicles may be overloaded while others remain underused.

Poor Route Planning

Vehicles spend too much time travelling between jobs.

Maintenance Downtime

Vehicles may remain unavailable for extended periods.

Seasonal Demand

Demand may fluctuate significantly throughout the year.

Low Capacity Utilization

Vehicles may operate with significant unused cargo capacity.

Driver Availability

Vehicles may remain parked because suitable drivers are unavailable.

Manual Fleet Management

Spreadsheets and disconnected systems can make it difficult to identify utilization patterns.

Finding the underlying cause allows managers to implement the right solution.


Fleet Utilization KPIs Every Fleet Manager Should Track

A comprehensive fleet utilization dashboard can include the following KPIs:

KPIWhat It Measures
Fleet Utilization %Overall fleet usage
Vehicle Utilization %Individual vehicle usage
Vehicle AvailabilityVehicles ready for operation
Idle TimeNon-productive vehicle time
DowntimeTime vehicles are unavailable
Trips per VehicleOperational productivity
Deliveries per VehicleDelivery productivity
Kilometres per VehicleVehicle activity
Capacity UtilizationUsed vs available capacity
Cost per TripOperating efficiency
Fuel per KMFuel efficiency
On-Time DeliveryService performance

No single KPI provides the complete picture.

The most useful approach is to analyze utilization alongside cost, productivity, fuel, and service metrics.


Fleet Utilization Example

Imagine a logistics company operates:

50 vehicles

Each vehicle is available for:

10 hours per day

That gives:

500 available fleet hours per day

Suppose the fleet generates:

350 productive operating hours

Fleet utilization would be:

350 ÷ 500 × 100 = 70%

At first glance, 70% may appear acceptable.

But deeper analysis might reveal:

  • 60 hours lost to excessive idle time
  • 40 hours lost to maintenance
  • 30 hours lost to poor scheduling
  • 20 hours lost to low demand

Now management has specific areas to address.

If better scheduling recovers 15 hours and route optimization recovers another 10 hours, utilization could improve without purchasing additional vehicles.

This demonstrates why fleet utilization is not simply a number.

It is a diagnostic tool for understanding how efficiently fleet assets are being used.


How Technology Improves Fleet Utilization

Modern fleet management systems can bring together multiple sources of operational data.

These may include:

  • GPS tracking
  • Vehicle location
  • Route data
  • Driver activity
  • Fuel information
  • Maintenance records
  • Delivery information
  • Vehicle availability
  • Fleet analytics

Instead of reviewing separate spreadsheets, fleet managers can use a centralized platform to understand vehicle performance.

For example, a manager could identify:

Vehicle 24 has low utilization

Vehicle spends 28% of available time idle

Most idle time occurs between 2 PM and 4 PM

Demand is low during this period

Vehicle schedule can be adjusted

This type of insight enables data-driven fleet management.


How AI Can Help Improve Fleet Utilization

AI can take fleet utilization analysis further by identifying patterns across large amounts of operational data.

Instead of simply reporting:

"Vehicle utilization is 68%."

an intelligent fleet platform can help answer:

"Why is utilization 68%?"

and potentially:

"What could improve it?"

AI-driven analysis can identify patterns involving:

  • Vehicle demand
  • Route performance
  • Delivery density
  • Idle periods
  • Maintenance patterns
  • Driver activity
  • Capacity usage
  • Historical utilization

For example, AI could identify that a specific vehicle category is consistently underused during certain periods and recommend reallocating vehicles based on demand patterns.

The objective is not simply to collect more data.

It is to turn fleet data into actionable decisions.


How Fleet Utilization Impacts Fleet Costs

Low utilization can increase the effective cost of operating a fleet.

Imagine two vehicles with similar ownership costs.

Vehicle A

  • 90% utilization
  • 20 deliveries/day
  • Low idle time

Vehicle B

  • 45% utilization
  • 8 deliveries/day
  • High idle time

Even if both vehicles cost the same to own, Vehicle A generates significantly more productive output.

This means utilization can influence:

Cost per delivery

Cost per trip

Cost per productive hour

Return on fleet investment

Improving utilization therefore isn't simply about keeping vehicles busy.

It is about increasing the amount of productive output generated from existing assets.


Should You Reduce Fleet Size When Utilization Is Low?

Not necessarily.

Low utilization can have several causes.

Before selling or replacing vehicles, fleet managers should determine why utilization is low.

Ask:

  • Is demand temporarily low?
  • Are vehicles poorly assigned?
  • Is there excessive downtime?
  • Are routes inefficient?
  • Are some vehicles unsuitable for current workloads?
  • Is the fleet oversized?
  • Is capacity being used effectively?
  • Are seasonal patterns affecting demand?

If the problem is poor allocation or scheduling, reducing the fleet could actually create operational problems later.

Fleet rightsizing should be based on long-term demand patterns and utilization data, not a short-term snapshot.


Best Practices for Improving Fleet Utilization

To continuously improve utilization, fleet managers should:

Set utilization benchmarks

Define realistic targets by vehicle type and business function.

Monitor individual vehicles

Don't rely only on fleet-wide averages.

Track idle and downtime

Identify why vehicles are unavailable or unproductive.

Match vehicles to jobs

Use the right asset for the right workload.

Improve route planning

Reduce unnecessary travel and increase productive stops.

Monitor capacity

Avoid consistently sending oversized vehicles for small loads.

Analyze demand patterns

Adjust fleet allocation based on time and location.

Use real-time visibility

Know where vehicles are and what they are doing.

Review utilization regularly

Compare daily, weekly, and monthly performance.

Connect utilization with financial metrics

Measure how utilization affects cost and productivity.


Frequently Asked Questions

What is fleet utilization?

Fleet utilization measures how effectively available vehicles are being used for productive business activities. It can include operating time, trips, deliveries, mileage, capacity, and revenue-generating activity.

How is fleet utilization calculated?

A simple time-based formula is:

Fleet Utilization % = Productive Operating Hours ÷ Available Operating Hours × 100

However, businesses should select the formula that best reflects their operational model.

What is a good fleet utilization rate?

There is no universal ideal percentage. The appropriate benchmark depends on vehicle type, industry, operating hours, demand patterns, maintenance requirements, and business objectives.

What is vehicle utilization?

Vehicle utilization measures how effectively an individual vehicle is being used. It helps fleet managers identify underused or overused assets.

How can I improve fleet utilization?

You can improve fleet utilization by optimizing routes, improving vehicle allocation, reducing idle time, minimizing downtime, improving scheduling, matching vehicles to workloads, and monitoring fleet performance through analytics.

Does fleet utilization affect operating costs?

Yes. Low utilization can increase the effective cost of ownership because fixed vehicle costs continue even when vehicles generate limited productive output.

Can GPS tracking improve fleet utilization?

GPS tracking provides visibility into vehicle location, movement, idle time, and activity. When combined with fleet analytics, this information can help managers identify utilization problems and improve vehicle deployment.

Can route optimization improve fleet utilization?

Yes. More efficient routes can reduce wasted travel time and increase the amount of productive work a vehicle completes during its operating period.

How often should fleet utilization be measured?

Fleet utilization should ideally be monitored continuously, with daily operational monitoring and weekly or monthly trend analysis depending on the fleet's size and operating model.


Conclusion

Fleet utilization is more than a percentage on a dashboard.

It is a measure of how effectively a business converts its fleet assets into productive output.

A vehicle sitting idle, spending excessive time in maintenance, travelling without a productive purpose, or operating below its available capacity can represent significant lost potential.

By measuring vehicle utilization, operating hours, idle time, downtime, capacity utilization, trips, deliveries, and fleet productivity, businesses can identify where that potential is being lost.

The next step is action.

Better scheduling, smarter vehicle allocation, route optimization, capacity planning, predictive maintenance, and fleet analytics can all contribute to improving fleet efficiency.

For growing fleets, the goal shouldn't simply be to add more vehicles.

It should be to get more productive value from the vehicles already available.

When fleet managers can clearly see how every vehicle is being used, they can make better decisions about routes, resources, maintenance, capacity, and future fleet investments.

Better fleet utilization means better asset productivity, lower inefficiency, and a more cost-effective fleet operation.

Share
  • Fleet Performance

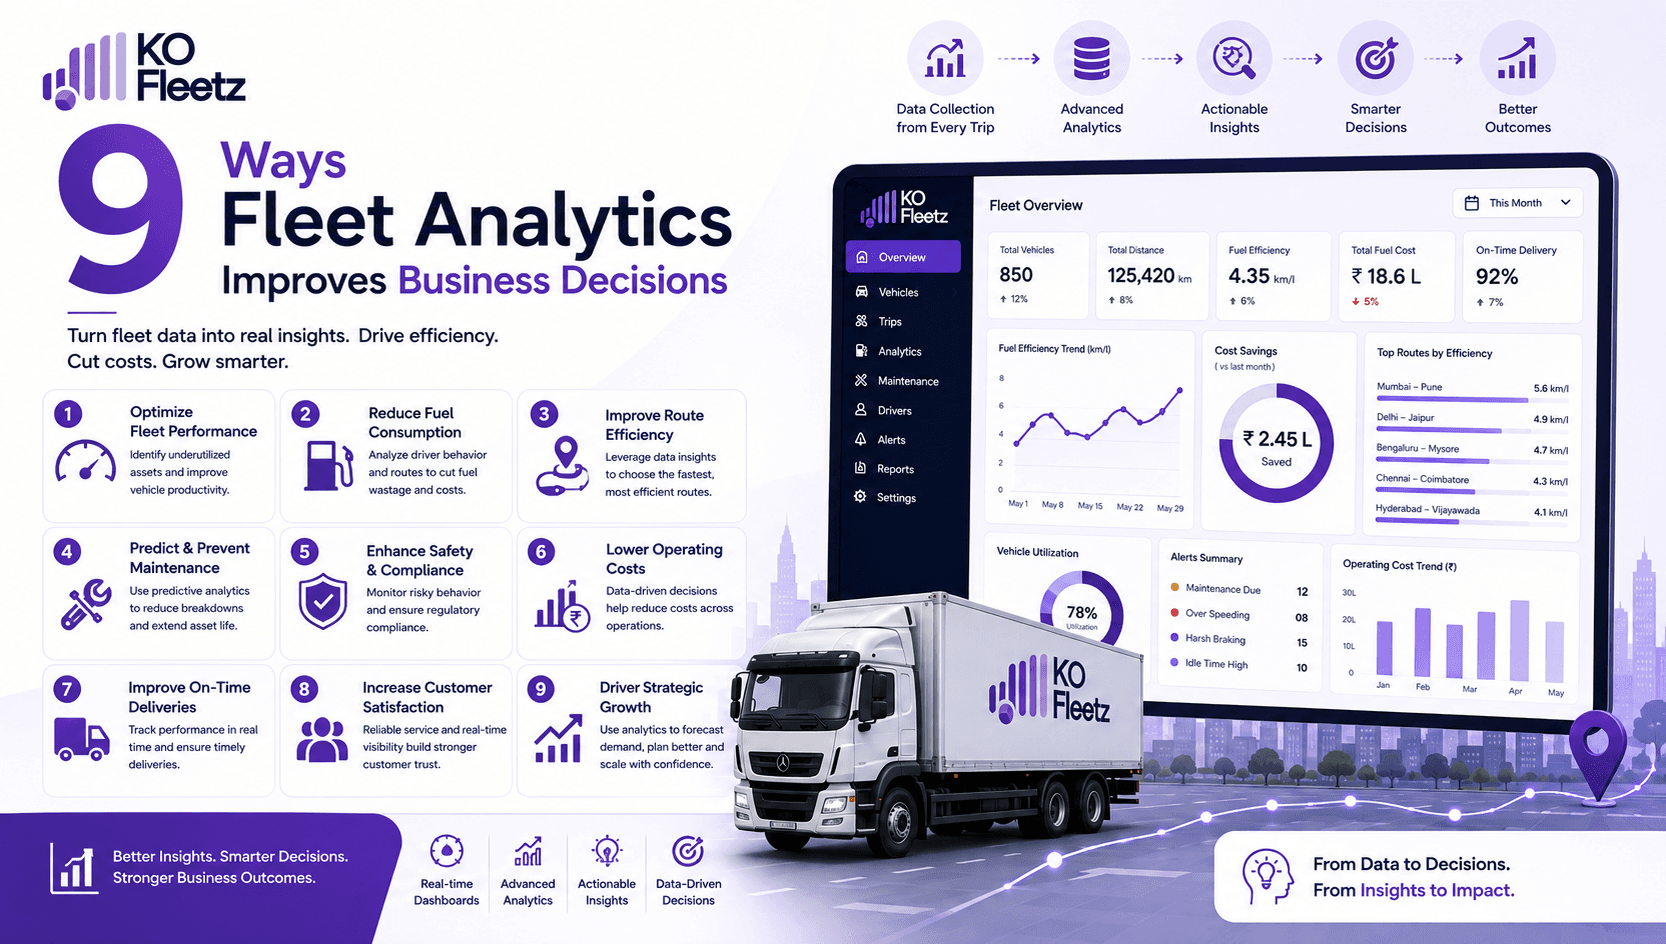
    9 Ways Fleet Analytics Improves Business Decisions

    Fleet analytics turns vehicle and operational data into clear insights that improve decision-making. From cost control and route efficiency to predictive maintenance and driver performance, see how fleet intelligence helps logistics businesses operate smarter.

    19 Aug 20264 min
  • FMCG & Distribution

    Fleet Management Software for FMCG Distribution

    Fleet management software for FMCG helps distributors optimize delivery routes, reduce fuel costs, improve vehicle utilization, track deliveries, and streamline daily distribution operations.

    31 Aug 20262 min
  • Manufacturing

    Fleet Management Software for Manufacturing Companies

    Discover how fleet management software helps manufacturing companies reduce transportation costs, improve vehicle utilization, minimize downtime, optimize fleet operations, and gain better visibility across their transportation network.

    28 Aug 20266 min

See KO Fleetz running on your fleet

A 30-minute walkthrough using your vehicles, your routes and the problems you are actually trying to solve.